Jun 5, 2026
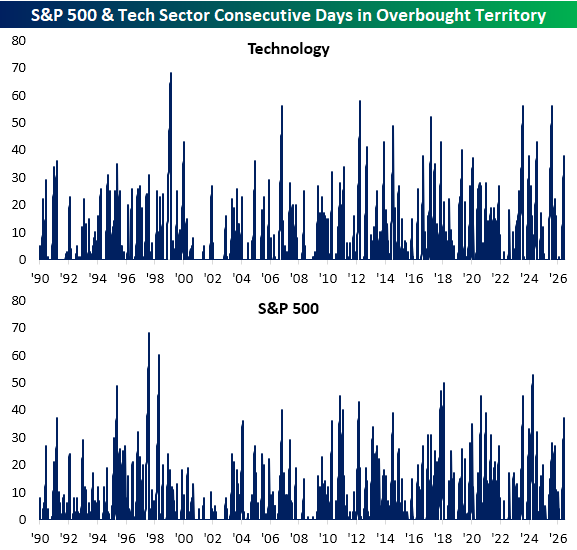
Equities are turning lower to end the week, putting the S&P 500 on pace to end a nine-week winning streak. The 2.25% decline as of this writing today also puts the index on pace to close within one standard deviation of its 50-DMA (neutral territory) for the first time since April 13th. Likewise, the Tech sector that has fueled much of the recent rally is pulling back sharply, eying a 5% decline on the session, to also end its streak of overbought readings.
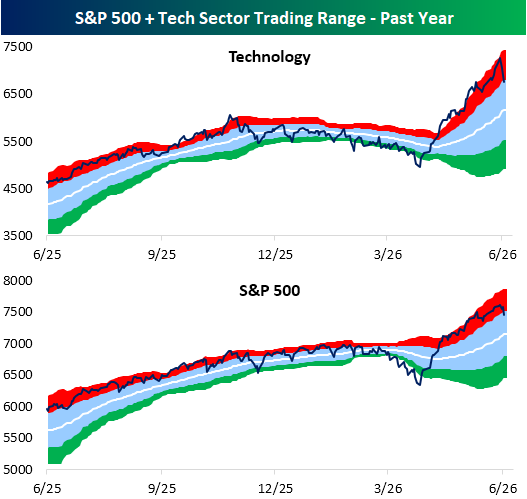
Tech has been overbought for 38 sessions in a row through yesterday’s close. Assuming today’s decline holds and the sector closes within one standard deviation of the 50-DMA, it would be the longest streak of overbought readings since July 31, 2025 when it had spent 56 sessions in a row in overbought territory. For the S&P 500, the aforementioned streak of elevated closes is now the longest since April 2024.
For the broad S&P 500, Friday’s decline is the largest single day drop since October 10, 2025 and for Tech, it’s been even longer since we have seen such a large decline. The sector is one pace to close with the largest daily decline since April 4, 2025.
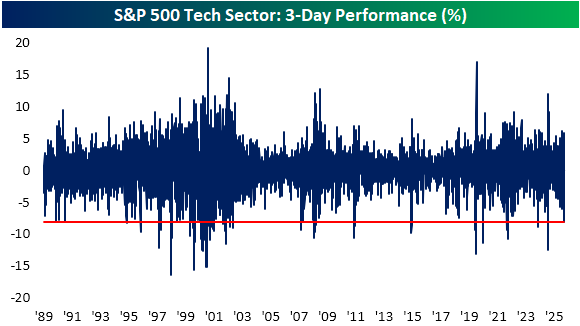
However, today’s decline is in the context of a few days of weakness. Tech peaked on Tuesday, and at the moment it is down over 8% versus that high. As shown below, that is the largest three day decline since the tariff fueled sell-off in the spring of last year. For all days since sector data beings in late 1989, the three-day drop ranks in the first percentile of all periods.
Want more from Bespoke? You can start by joining our Think BIG mailing list where you’ll receive an interesting market stat in your inbox a few times per week. All we need is your email address. Join now by clicking here or on the image below.

Jun 4, 2026
Log-in here if you’re a member with access to the Closer.
- Low volatility stocks have experienced historic underperformed recently whereas momentum has outperformed massively.
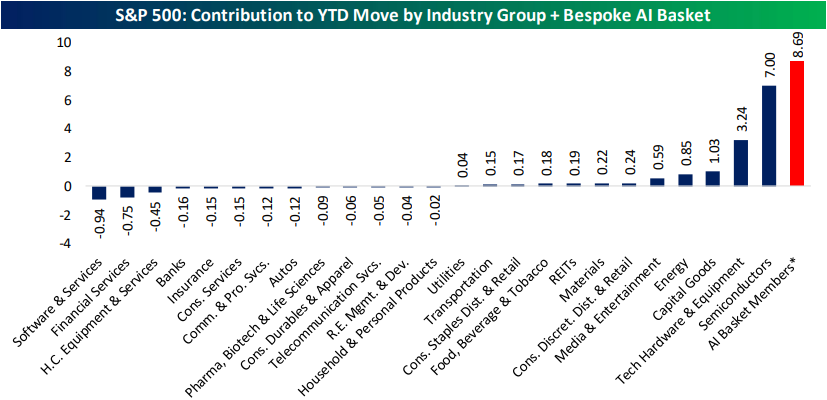
- Tech industries, or more specifically the AI trade, is to thank for a vast majority of YTD gains.
- Home listing prices are down to the lowest level since April 2022 as inventories have risen.
See today’s full post-market Closer and everything else Bespoke publishes by starting a 14-day trial to Bespoke Institutional today!
Jun 3, 2026
Log-in here if you’re a member with access to the Closer.
- Strategic petroleum reserves continue to experience a record drawdown as distillate inventories approach multi-decade lows.
- Even after an updated methodology was introduced in 2022, the explanatory power of the ADP payrolls estimate for the official BLS data is very low.
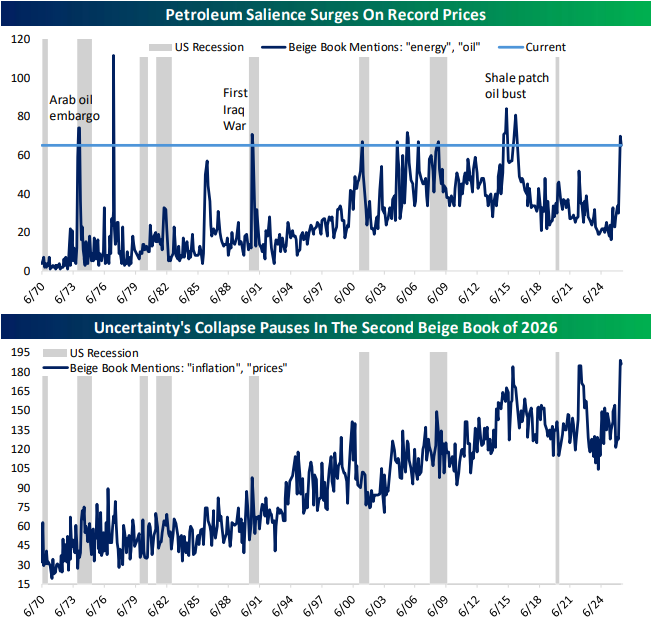
- The latest release of the Beige Book showed slightly weaker evaluations of the economy relative to the prior release as inflation and energy mentions were commonplace.
See today’s full post-market Closer and everything else Bespoke publishes by starting a 14-day trial to Bespoke Institutional today!
Jun 3, 2026
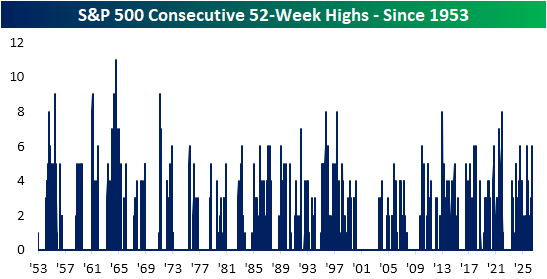
As the S&P 500 is turning decisively lower today, currently down 0.6% as of this writing, the index is on pace to end a nine-day winning streak. Not only that, but since coming back from the Memorial Day holiday, the S&P 500 has closed at a record high each session up until today. As shown below, this marks the 34th time since the inception of the current five-day trading week that the index has logged a streak of six or more consecutive 52-week highs. The most recent other examples were also exactly six days long, ending in July of 2024 and 2025.
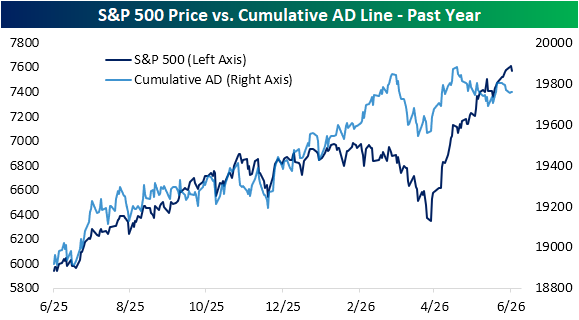
One topic we have frequently covered over the last couple of months has been the S&P 500’s continued surge to record highs despite signs of weak participation. While the index’s cumulative A/D line has been basically rangebound all year, a clear divergence has emerged since mid-April: price has continuously made new highs, but the A/D line has been trending lower.
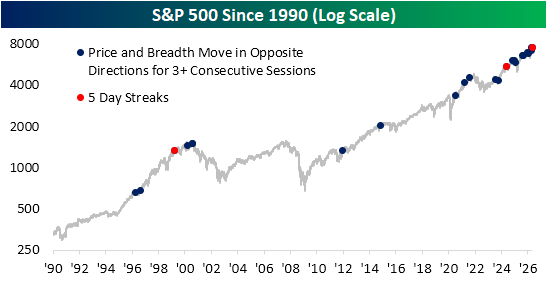
Again, looking to the past several days, price action has resulted in a historic streak that we have been keeping tabs on in our Daily Sector Snapshot. Not only has the S&P 500 reached 52-week highs each day through yesterday’s close, but it did so with the daily advance/decline number being negative for most. Of that string of record highs, yesterday was the first one on positive breadth. In other words, last Tuesday through this past Monday, all saw a positive daily change in the S&P 500 on negative breadth. There have only been two other times since 1990 when the daily change in price and breadth moved in opposite directions for five sessions in a row—the first in April 1999 and the other in June 2024—and further, there has never been such a long streak when each of those days resulted in 52-week highs.
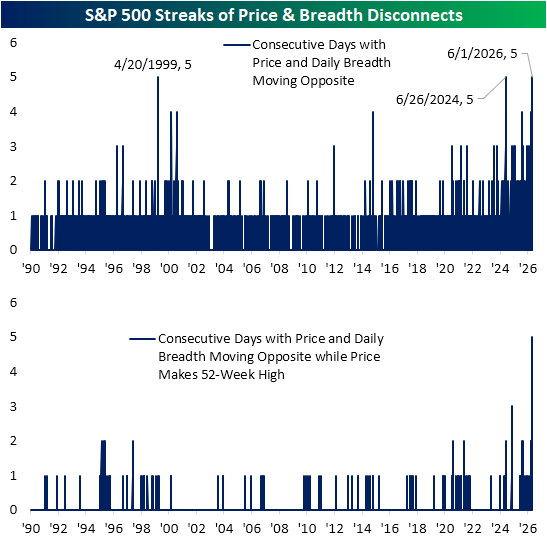
In the chart below, we highlight those streaks of consecutive days in which price and breadth moved in opposite directions for at least three sessions in a row, and also highlight those streaks, like the most recent that went on to five days. As shown, those instances have become increasingly common in recent years as the S&P 500 has grown increasingly concentrated, as we discussed in today’s Chart of the Day.
With the July 4th holiday coming up, make sure to pick up one (or two or three) of our fun t-shirts or sweatshirts to wear for the 250th. You can find them at Bespoke Threads or an even wider selection at our Task Force 250 store.

Want more from Bespoke? You can start by joining our Think BIG mailing list where you’ll receive an interesting market stat in your inbox a few times per week. All we need is your email address. Join now by clicking here or on the image below.