Jun 8, 2026
Log-in here if you’re a member with access to the Closer.
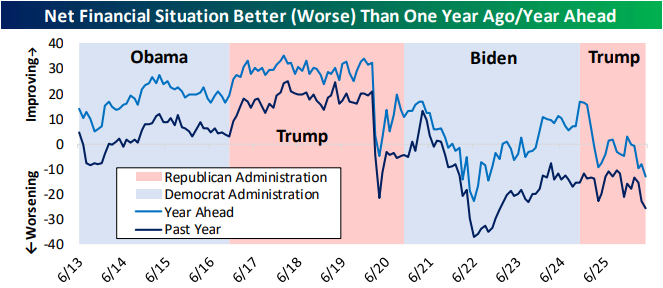
- Consumer facing stocks like durables, apparel, and lenders have made lower highs recently.
- The New York Fed’s Survey of Consumer Expectations saw a multiyear low in the range of one year inflation expectations.
- Consumer expectations for their financial situation in the year ahead had the worst showing since October 2022.
See today’s full post-market Closer and everything else Bespoke publishes by starting a 14-day trial to Bespoke Institutional today!
Jun 8, 2026
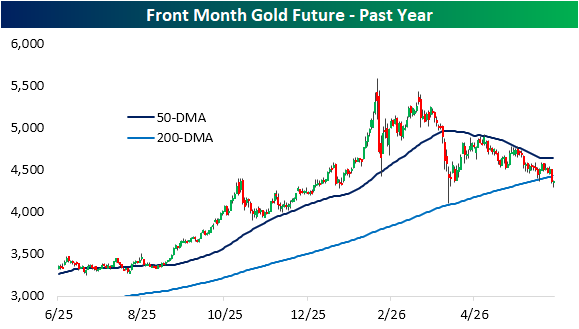
Precious metals had a banner year in 2025, and that strength pulled through into the first month of 2026, peaking on January 29th. Closing in on the midpoint of the year, gold has been falling and is now basically back to flat on the year (now up 0.6% YTD). In the past few months as gold has reversed earlier gains, it has been consolidating between an upward trending 200-DMA to the downside, and a downward trending 50-DMA to the upside. Last Friday, the yellow metal picked a direction as it closed below its 200-DMA for the first time in two and a half years.
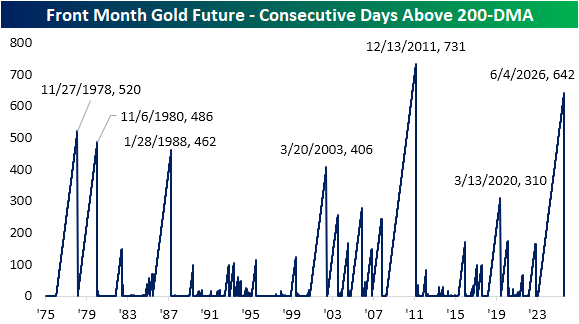
As shown below, Friday’s close below the 200-DMA was the first instance since November 10, 2023. That 642-trading day streak ended what was the second longest on record behind the 731-trading day streak ending in December 2011. For all streaks since 1975, it is only the seventh time it has extended to 300 trading days or more.
Want more from Bespoke? You can start by joining our Think BIG mailing list where you’ll receive an interesting market stat in your inbox a few times per week. All we need is your email address. Join now by clicking here or on the image below.

Jun 8, 2026
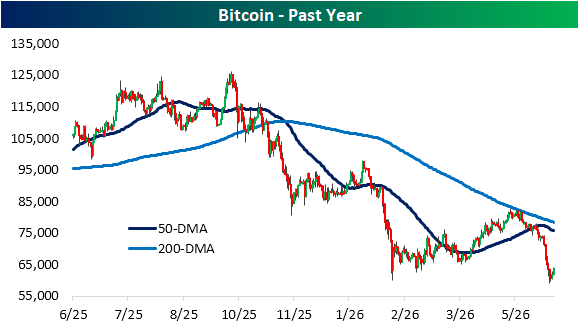
While there was a small rebound in weekend trading in addition to the start of the week on Monday, Bitcoin remains one of the more notable pain trades of late. As shown below, the world’s largest cryptocurrency has been in a downtrend since last fall when it broke below its 200-DMA. With a series of lower highs and lower lows since then, Bitcoin made an attempt to run up to that moving average as recently as mid-May, but the steep leg lower since then has resulted in 52-week lows last week when it traded below $60K for the first time since October 2024.
Talk about an ugly chart…
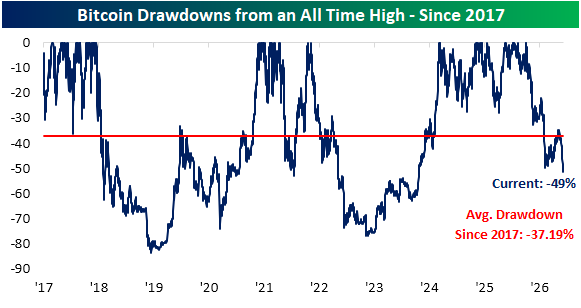
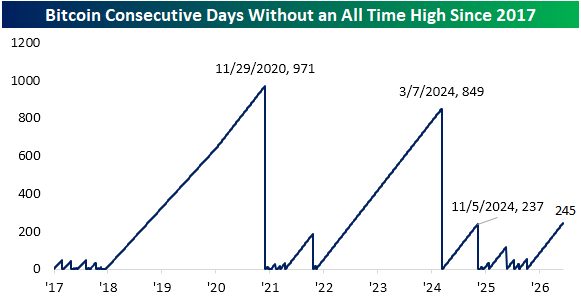
In the chart below, we show bitcoin drawdowns from all time highs since 2017 (when the crypto first traded above $1,000 and roughly when it came into the mainstream). It goes without saying that Bitcoin has been a volatile instrument. Since the start of 2017, it has been in a 37% drawdown on average. That includes a couple extended periods without new highs such as from 2018 through 2020 and 2022 through 2024. The crypto again finds itself in not only a longstanding drawdown (as of Monday it is on its 245th day without a fresh high, the third longest streak on record), but nearly cut in half versus its high from last October.
Want more from Bespoke? You can start by joining our Think BIG mailing list where you’ll receive an interesting market stat in your inbox a few times per week. All we need is your email address. Join now by clicking here or on the image below.
Jun 5, 2026
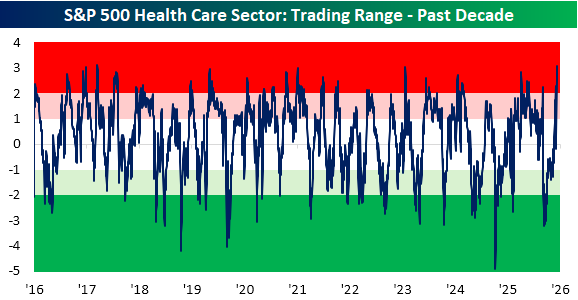
While the S&P 500 is getting hit hard in the past few days (and especially today) largely thanks to weakness in Tech stocks, there has been one glimmer of light. The Health Care sector has been flying higher, now up 5.2% in the past three sessions alone. After that move, Health Care is extremely overbought trading over 3 standard deviations above its 50-DMA. That is the first time the sector traded at least 3 standard deviations above its 50-day since July 21, 2023, and at the current level (3.08 st. dev. above), it is the most overbought since September 11, 2017.
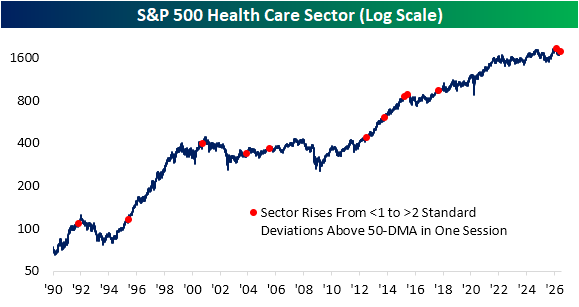
Not only has Health Care gotten extremely overbought, it did so quickly. In fact, as recently as Wednesday, the sector wasn’t even a full standard deviation above its 50-DMA. With an over 3% gain on Thursday, the sector finished over 2 standard deviations above its 50-DMA. Since the start of our data in late 1989, there have only been a dozen times (including this week) that Health Care went from less than one standard deviation above its 50-DMA to extremely overbought in the span of one session. As shown below, the most recent of these was actually this past February, but before that, the last instance was all the way back in 2017.
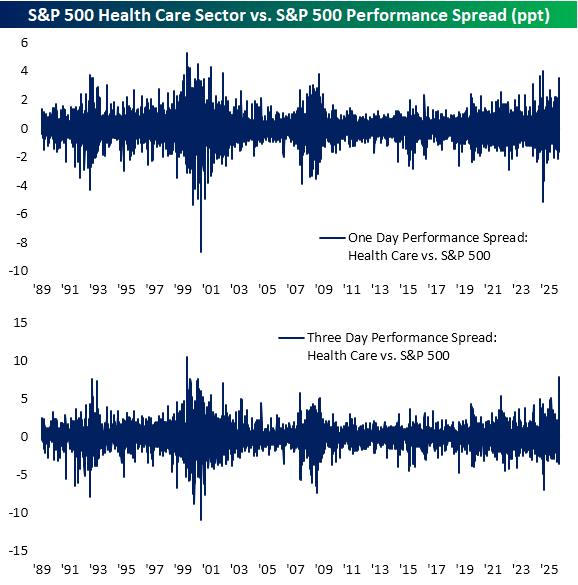
While the size of the move in the past few days is large and the extent to which it has gotten extended is notable, perhaps the most striking aspect of the rally is in relation to the S&P 500. As shown in the first chart below, Health Care’s 1.3% gain versus the S&P 500’s over 2% decline on the session on Friday is one of the largest divergences between the two on record. Factoring in the past three sessions, Health Care’s 7.8 percentage points of outperformance relative to the broader market is second only to January 7, 2000 (when it outperformed by 10.5 percentage points).
Want more from Bespoke? You can start by joining our Think BIG mailing list where you’ll receive an interesting market stat in your inbox a few times per week. All we need is your email address. Join now by clicking here or on the image below.