Jan 23, 2023
As we noted in today’s Morning Lineup, we may technically be in the midst of earnings season, but we have yet to see too heavy of a slate of reports. We are kicking off this week with another quiet day with only 11 reports scattered before and after the bell. Earnings will ramp up dramatically starting tomorrow, though, with the calendar remaining busy through the next month. As shown in the snapshot from our Earnings Explorer tool below, after today there will be another nearly 200 reports scheduled for this week alone.

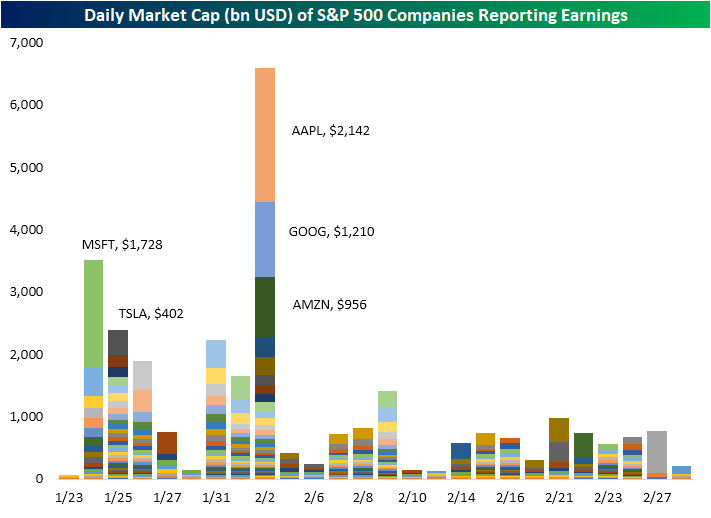
While the number of stocks reporting will remain high through February, this week and next will see the bulk of companies in terms of market cap. In the chart below from last Friday’s Bespoke Report, we show each day’s daily market cap of S&P 500 companies scheduled to report earnings through the end of February. Through next Friday alone, a combined $19.8 trillion in market cap will report, or 57% of the S&P 500’s total market cap. That includes the mega-cap names with Microsoft (MSFT) leading things off tomorrow followed by Tesla (TSLA) on Wednesday. Next Thursday, the combined $4.3 trillion in market cap from Apple (AAPL), Alphabet (GOOGL), and Amazon (AMZN) will all be out on the same day. After that, Berkshire Hathaway (BRK/B) will be the last remaining mega-cap stock to report earnings, and that will not be until February 27th.
To keep track of all upcoming earnings reports, be sure to check out our Earnings Explorer.Click here to learn more about Bespoke’s premium stock market research service.
Jan 20, 2023
Bespoke’s Crypto Report contains numerous technical, momentum, and sentiment charts for bitcoin, ethereum, and other key cryptos. Page 1 of the report includes our weekly commentary on the space and attempts to identify any new trends that are emerging. The remaining pages include important overbought/oversold levels to watch, charts on historical drawdowns and rallies, seasonality trends, futures positioning data, Google search trend shifts, and more. Our weekly Crypto Report is produced so that followers of the space can more easily stay on top of price action, technicals, seasonality, and sentiment.
Sign up for a monthly or annual subscription to Bespoke Crypto to receive our weekly Crypto Report and anything else we publish related to cryptos. Note: If you’re currently a Bespoke Premium, Bespoke Newsletter, or Bespoke Institutional subscriber, you’ll need to subscribe to Bespoke Crypto as an add-on to receive access. The weekly Crypto Report and any additional crypto analysis is not included with our Premium, Newsletter, or Institutional memberships. You can sign up for Bespoke Crypto and receive our Crypto Report in your inbox weekly using the monthly or annual checkout links below. If you sign up for the annual plan, the first year of access is 50% off!
Bespoke Crypto Access — Monthly Payment Plan ($49/mth)
Bespoke Crypto Access — Annual Payment Plan ($247.50 for the first 12 months, then $495/year in year 2 and beyond)
Bespoke Investment Group, LLC believes all information contained in this service to be accurate, but we do not guarantee its accuracy. None of the information in this service or any opinions expressed constitutes a solicitation of the purchase or sale of any securities, commodities, or cryptocurrencies. This service contains no buy or sell recommendations. This is not personalized advice. Investors should do their own research and/or work with an investment professional when making portfolio decisions. As always, past performance of any investment is not a guarantee of future results. Bespoke representatives or clients may have positions in securities discussed or mentioned in its published content.
Jan 19, 2023
Log-in here if you’re a member with access to the Closer.
Looking for deeper insight into markets? In tonight’s Closer sent to Bespoke Institutional clients, we begin with an update on how cyclicals have done relative to defensives and how much recent equity moves have to do with rotation (page 1). We then turn over to economic data with a recap of today’s residential construction numbers (pages 2 – 4) as well as an update of our Five Fed Composite (page 5). We then review the latest petroleum stockpile numbers (page 6) before closing with a recap of the 10 year TIPS auction (page 7).

See today’s full post-market Closer and everything else Bespoke publishes by starting a 14-day trial to Bespoke Institutional today!