Mar 15, 2023
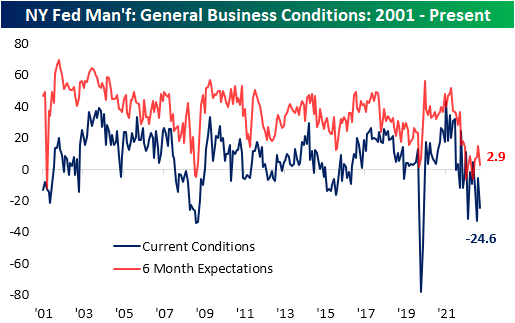
Among the bad news this morning was disappointing economic data in the form of the New York Fed’s Empire Manufacturing report. The report was expected to remain in contraction falling to -7.9 versus a reading of -5.8 last month. Instead, the index plummeted to a much weaker reading of -24.6. Although that is not a new low with even weaker readings as recently as January and last August, the report indicated a significant deterioration in the region’s manufacturing sector, and whereas weather in January was an easy scapegoat for the weakness, that’s not the case for the March report.
Given the large drop in the headline number, breath was equally bad with many other significant declines. Like the headline number’s 5th percentile reading and month-over-month decline, New Orders and Shipments both saw double-digit declines into bottom decile readings. In the case of Shipments, that low reading comes after an expansionary reading last month. Inventories was the only other current conditions index to move from expansion to contraction leaving Prices Paid and Prices Received as the last expansionary categories.

As mentioned above, demand appears weak as New Orders and Shipments are the two most depressed categories from a historical perspective with each index coming in the bottom 3% of all months since the start of the survey in the early 2000s. Six-month expectations are equally low. Unfilled Orders were one of two categories to see a higher reading month over month with the 2.5 point increase much smaller than the move in expectations. Unfilled Orders expectations surged by 12.1 points, ranking in the 95th percentile of all monthly moves on record. That would indicate the region’s firms expect unfilled orders to rise at a rapid pace in the months ahead, likely as a result of weakened sales. That does not mean the area’s firms are expecting inventory build-ups, though. Inventory expectations saw a modest 1.4-point increase month over month in March, but that remains one of the lower readings of the past decade.

The only other current conditions index to move higher month over month was delivery times. Even though it moved higher, the index continues to indicate lead times are rapidly improving and expectations are calling for those improvements to continue.

Next to the dampened demand picture, employment metrics were perhaps the next most jarringly negative. Hiring is falling precipitously with the Number of Employees index hitting a new cycle low of -10.1. Average Workweek also is reaching new lows. At -18.5 it has only been as low during the spring of 2020 and during 2008 and 2009. Click here to learn more about Bespoke’s premium stock market research service.

Mar 14, 2023
Log-in here if you’re a member with access to the Closer.
Looking for deeper insight into markets? In tonight’s Closer sent to Bespoke Institutional clients, we begin with commentary on the geopolitical tensions arising from the Black Sea and domestic political speak from recent bank activity (page 1). We then pivot into a review of today’s CPI data (page 2) including the potential paths ahead inflation can take (page 3). We also take a look at CPI in Argentina (page 4). We finish with a look at a decile analysis showing just how rotational today’s price action was (page 5).

See today’s full post-market Closer and everything else Bespoke publishes by starting a 14-day trial to Bespoke Institutional today!
Mar 14, 2023
Early this morning, the NFIB released the results of its February survey of small business optimism. The headline index rose to 90.9 versus expectations of it remaining unchanged at 90.3. In spite of the bounce, small businesses continue to report some of the worst sentiment of the past decade with the February reading right back in line with the April 2020 low.

Diving deeper into the categories of the report, breadth was mixed. Of the ten inputs into the headline number, four were lower month over month, one was unchanged, and the other half were higher. For the most part, these indices also remain in the bottom decile of their historical readings.

In today’s Morning Lineup, we highlighted how the report’s labor metrics have been improving in each of the past four months on an aggregate basis. Plans to increase employment remain healthy in the 77th percentile while the percentage of respondents reporting job openings as hard to fill hit a new record high after rising by a near record 9 points month over month. Although openings were harder to fill, firms also took on more workers. With actual employment changes moving up to 4, it hit the highest level of the post-pandemic period. However, that did clash with hiring plans falling 2 points to match December for one of the lowest readings of the past few years. Likewise, plans to increase compensation are at the lower end of their recent range even while actual observed changes to compensation have improved in the past few months.

The same dynamic in which plans are headed in the opposite direction of actual changes can be observed with regards to capital expenditures. Capital expenditure plans were unchanged at 21 last month for the joint lowest reading since March 2021. Meanwhile, actual capital expenditures rose to 60, the highest since March 2020 and credit conditions have improved. Turning to inventories, satisfaction (meaning the net percent of firms reporting if inventories are too low versus too high) fell to the lowest since the spring of 2020. As a result, a net 7% of firms are reporting that they plan to decrease inventories in the coming months.

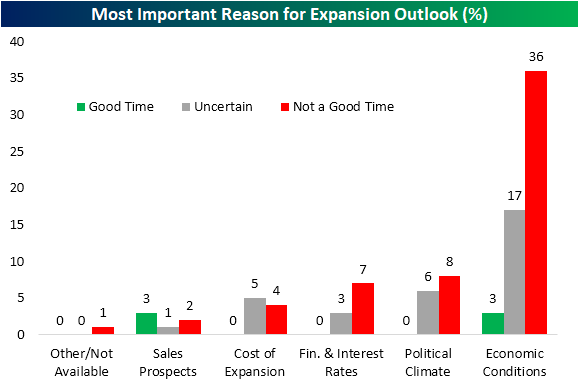
Finally, we would note that on net more firms are seeing lower rather than higher sales in spite of improvements to inflation metrics. The outlook for general business conditions has yet to see any improvement as few businesses report now is a good time to expand.

Most firms report now as a poor time to expand due to economic conditions at 36% of responses. The next most commonly credited reason is political climate followed by interest rates, which at 7% match the December reading for the highest since at least 2020. Click here to learn more about Bespoke’s premium stock market research service.