Claims Come in Strong
After disrupting the trend of lower readings last week, this week’s reading on initial jobless claims returned to improvements as the print totaled 192K. That means eight of the last nine weeks have seen claims come in below 200K as the indicator continues to show a historically healthy labor market.
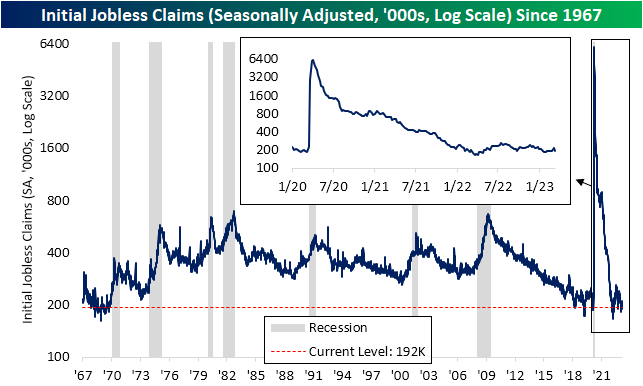
Before seasonal adjustment, claims are sitting at 217.4K. That marked a slight decline from 238.8K the previous week and little change versus the comparable week last year. From this point of the year, based on seasonal patterns claims are likely to continue falling through the spring albeit at a slower rate than what has been observed over the past few months.

Not only were initial claims strong, but so too were continuing claims. The seasonally adjusted number fell back into the 1.6 million range after topping 1.7 million (the highest level since mid-December) last week. Like initial claims, continuing claims remain at healthy levels consistent with the few years prior to the pandemic. Click here to learn more about Bespoke’s premium stock market research service.

Bulls Back Below 20%
The fallout from bank failures over the past week has put a major dent in investor sentiment. Since the week of February 23rd, optimism has been muted with less than a quarter of respondents to the weekly AAII sentiment survey having reported as bullish. That includes a new low of 19.2% set this week. That is the least optimistic reading on sentiment since September of last year.
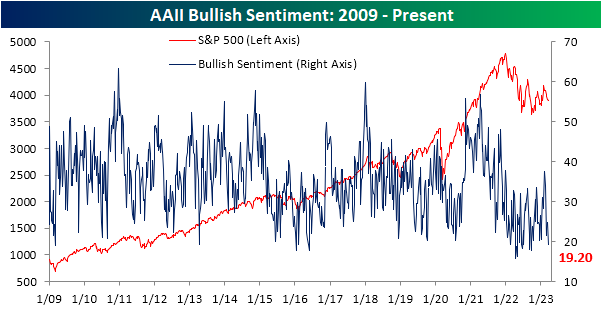
The drop in bullishness was met with a corresponding jump in bearish sentiment. That reading climbed from 41.7% up to 48.4%, the highest level since the week of December 22nd. While close to half of respondents are reporting as bearish, that remains well below the much higher readings that eclipsed 60% last year.

Last month saw the end to a record streak in which bearish sentiment outweighed bullish sentiment. However, the bull bear spread has now been negative for four weeks in a row once again. In fact, this week was the most negative reading in the spread since late December.

Factoring in other sentiment readings like the Investors Intelligence survey and the NAAIM Exposure Index—both of which similarly saw sentiment pivot toward more bearish tones this week—our sentiment composite is once again below -1, meaning the average sentiment indicator is reading extremely bearish sentiment. While prior to 2022 such depressed levels of sentiment were not commonplace, it has been the norm over the past year or so. Click here to learn more about Bespoke’s premium stock market research service.

The Closer – Pure Fear – 3/15/23
Log-in here if you’re a member with access to the Closer.
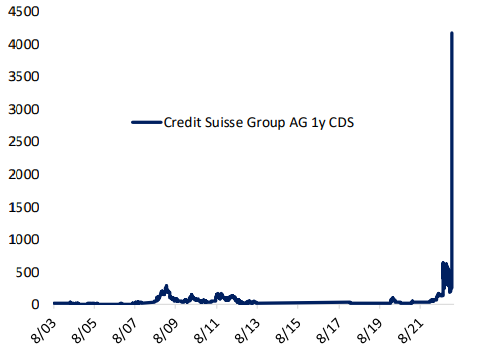
Looking for deeper insight into markets? In tonight’s Closer sent to Bespoke Institutional clients, we begin with a look at the moves in 2 year yields and the massive surge in Credit Suisse CDS spreads (page 1). We follow up with a look into today’s PPI data (page 2) then a look at delinquency data (page 3) and the latest petroleum stockpile numbers (page 4).
See today’s full post-market Closer and everything else Bespoke publishes by starting a 14-day trial to Bespoke Institutional today!