The Closer – Big Bond Sale, BDC, Housing – 3/10/26
Log-in here if you’re a member with access to the Closer.
- Amazon (AMZN) is the latest IG borrower to tap the bond market for capital for data centers, and today’s tranche ranked as the fourth-largest IG bond sale ever..
- Business development companies have gotten crushed over the past year resulting in some high yields and extreme valuations.
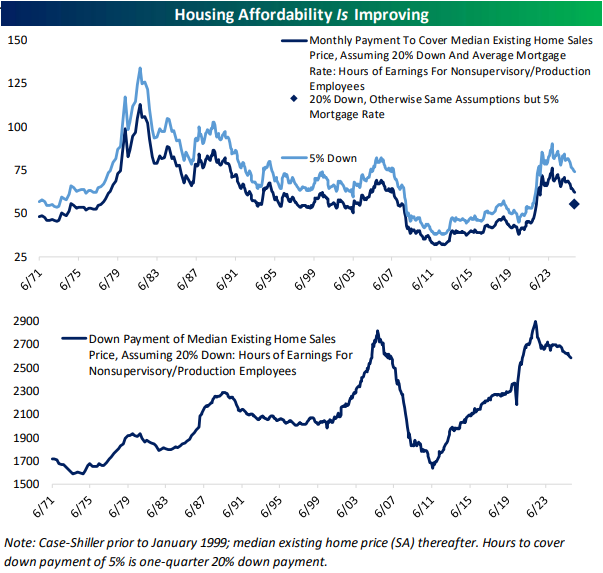
- Falling mortgage rates, little changing home prices, and and steady wage growth have benefitted housing affordability.
See today’s full post-market Closer and everything else Bespoke publishes by starting a 14-day trial to Bespoke Institutional today!
A Range Like Few Others
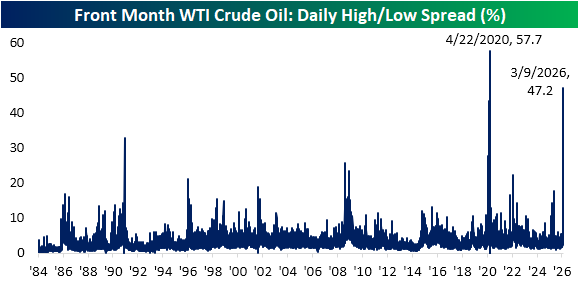
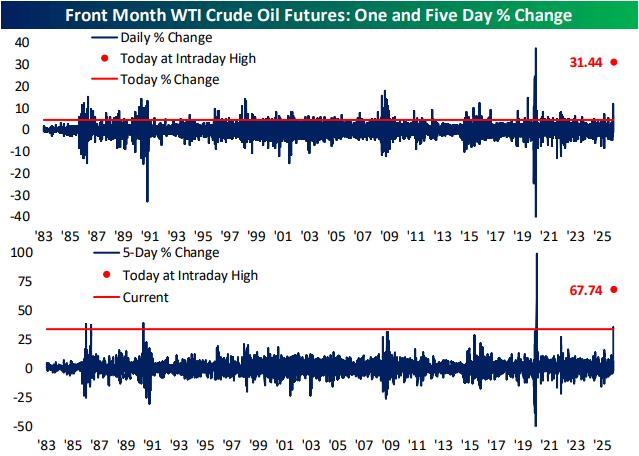
The situation in Iran, among other catalysts, has understandably raised volatility. As we discussed in today’s Chart of the Day, the S&P 500 (SPY) has been experiencing historic intraday moves so far this year, and of course, yesterday’s massive swings in crude oil prices are perhaps the prime example of heightened volatility. We highlighted in the Closer last night how front-month WTI went from trading just shy of $120 at its overnight highs Sunday, which would have been one of its largest daily gains on record. However, the steep drop in afternoon trading erased much of those gains. Today, the pullback has continued with another roughly 10% decline in both WTI and Brent futures. As shown below, the well over 40% intraday high and low range for crude prices yesterday made for WTI’s second largest intraday range in percentage terms. The only time with a wider intraday range was in the spring of 2020, around the time that prices briefly went negative. Even today, as the intraday high/low range has “moderated” to 10.5% for WTI as of this writing, that reading would rank in the 98th percentile of all periods since 1984.
Like this analysis? Join our premium members by starting a trial today! Click below for details on how to sign up:

Small Business Sales Surge
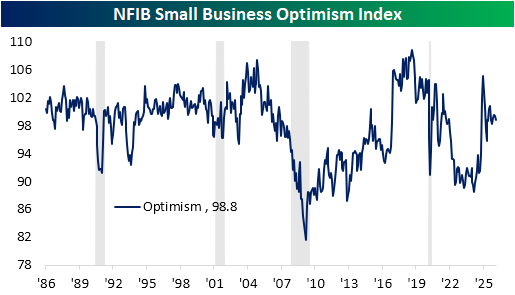
This morning, the NFIB published its latest update on small business sentiment. At 98.8, the headline Optimism Index came in below expectations of 99.6 and last month’s reading of 99.3. As shown below, current readings are now middling versus the recent range following the 2024 Election surge and all readings throughout the survey’s history. In fact, the current reading is just below the historical median ranking in the 45th percentile.
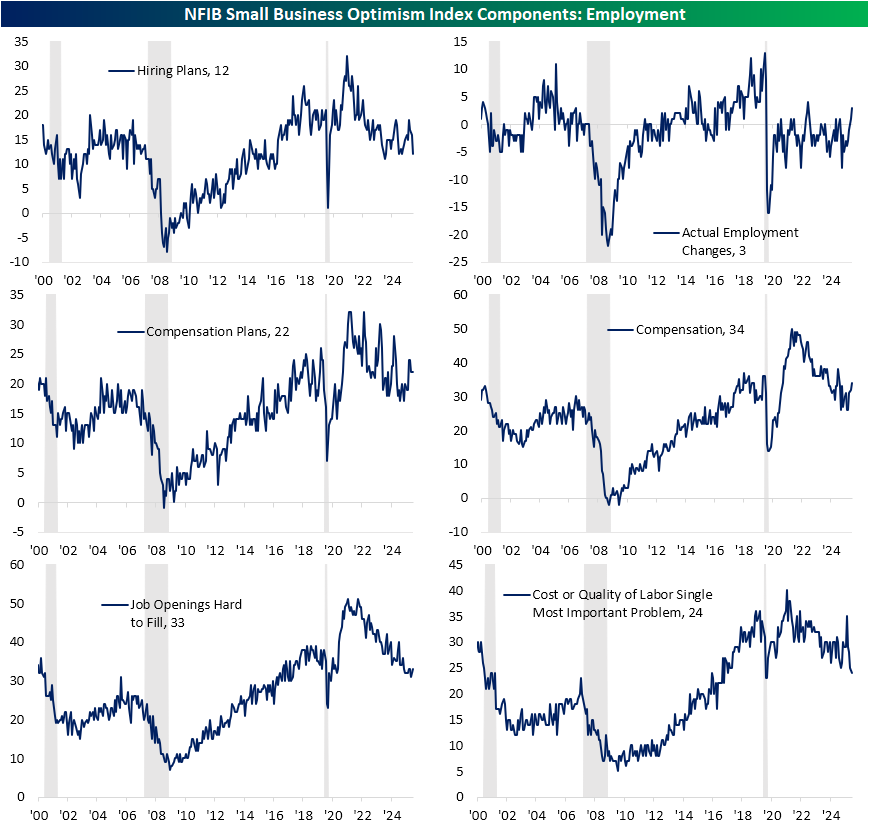
As we discussed in today’s Morning Lineup, labor-centric indices included in the NFIB report have suggested improvement over the past year, with another modest month-over-month increase most recently in February. Looking more closely, there are some interesting readings. For starters, hiring and compensation plans appear to be where there has been deterioration. While the latter was unchanged from recent highs in February, the former ranked as one of the larger declines across categories. Hiring plans dropped 4 points to the lowest level since May. Versus the reading of 16 last month, this index went from the 70th percentile down to below the historical median.
Despite those weaker readings in labor-related plans, actual labor changes were much more positive in February. For starters, actual employment changes came in net positive, which has been rare in the post-pandemic period. Further, that was the highest reading since February 2023. Compensation plans rebounded in tow to an eleven-month high. Finally, we would note that among the most important problem section of the report, the combined reading of the two labor-related problems was the lowest since May 2020.
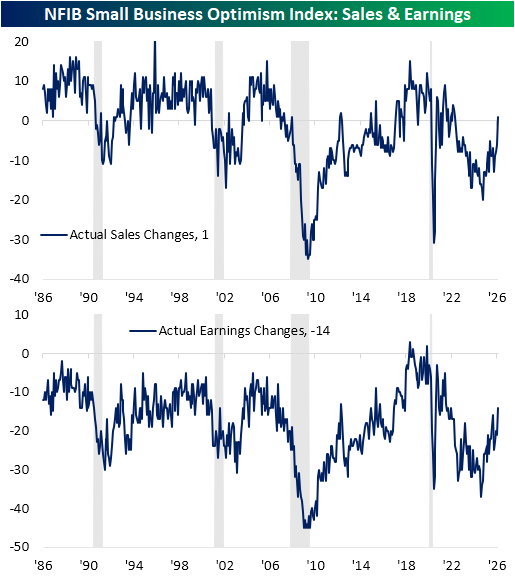
Similar to how “actual” indices were stronger than “expectation” indices regarding labor, the same dynamic was apparent for sales and earnings. Actual sales and earnings both surged in February. Top-line changes were reported as net positive for the first time since May 2022. Actual earnings changes have rarely come in net positive over the history of the survey, but this index rose to the most elevated reading since December 2021.
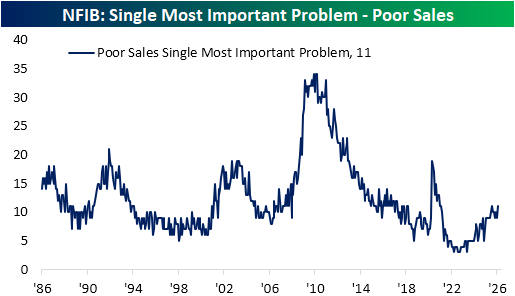
Ironically, the most important problem section again had an idiosyncratic reading versus the aforementioned actual sales change index. 11% of firms reported poor sales as their biggest issue, matching last July for the highest reading since February 2021.
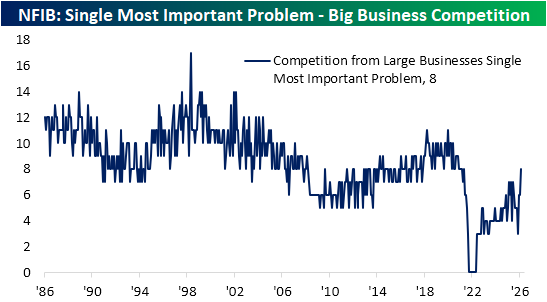
On the heels of the rise in poor sales concerns have been worries about competition from big business. As shown below, that problem has surged from negligible readings in 2022 to 8% of responses in February, the most since May 2021.
Like this analysis? Join our premium members by starting a trial today! Click below for details on how to sign up:
The Closer – Crude Craziness, Risk Bounce, Expectations – 3/9/26
Log-in here if you’re a member with access to the Closer.
- Markets continue to try to make sense of the Iran situation, making for a historic reversal today for crude prices.
- High volatility has showed that it works both ways with both crude and equities rebounding from sizable losses.
- Preliminary EPA estimates showed that nearly a third of consumer vehicles sold were EVs, hybrids, or fuel cell last year.
See today’s full post-market Closer and everything else Bespoke publishes by starting a 14-day trial to Bespoke Institutional today!