Mar 23, 2026
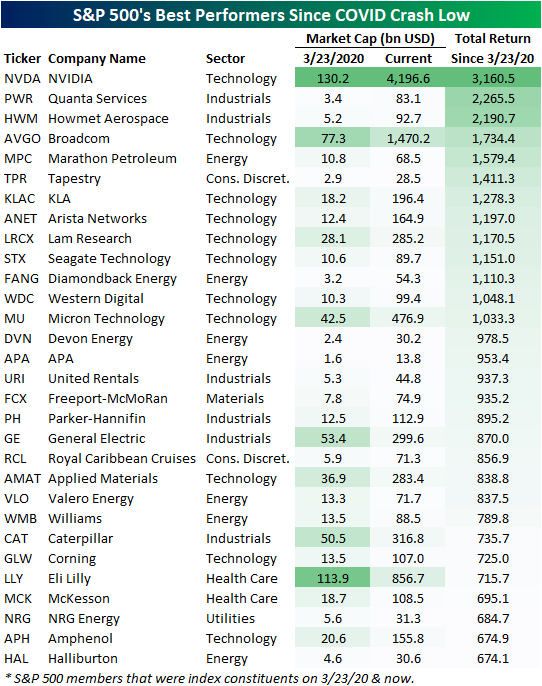
While it may feel like either ancient history or as though it was just yesterday, six years ago to the day, the S&P 500 put in its COVID Crash low. A lot has happened since then, but US equities have charged higher nonetheless. Since that low, the S&P has risen nearly 200%, with a number of huge moves under the surface driving those gains. In the table below, we show the 30 S&P 500 stocks that were a part of the index both at the time of the COVID Crash low (3/23/20) through today that have experienced the largest rallies over the past six years.
In total, there have been 17 ten-baggers since the COVID Crash low, and five stocks are up 1,500%+. That includes both Broadcom (AVGO) and NVIDIA (NVDA), which have joined the trillion dollar market cap club.
The 30 stocks shown below had a collective market cap of $735 billion at the time of the COVID low. Today, their combined market cap has eclipsed $10 trillion!
NVDA has been by far the biggest winner over this span thanks to both the early 2020s crypto boom and the emergence of AI. A number of Energy stocks have also found themselves on this list, thanks to a combination of solid dividend yields and exceptional price returns, especially more recently.
One final name that has been a top performer since COVID may be a surprise: Royal Caribbean Cruises (RCL). Even though six years ago this name was at the epicenter of lockdown doom, it’s up 857% since, which ranks as the 20th best.
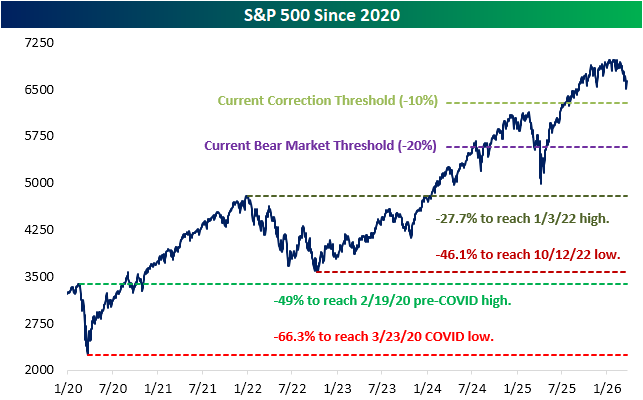
Pivoting back to the broader market, below we show the S&P 500 since the start of 2020. In the past several years, apart from the COVID Crash, there have been plenty of tough periods for the market including a prolonged bear in 2022, a near bear this time last year during the height of tariff turmoil, and this month once again with the war in Iran.
Amidst the turmoil, stocks haven’t struggled to eventually recover, and it would now take historic declines to return to levels from those prior periods.
Even after pulling back some from recent highs, we would note that it would require a 27.7% decline from current levels for the S&P 500 to return to its first post-COVID bull market high (1/3/22), and it would take a 46.1% drop to get back to the October 2022 bear market low.
For some historical context, only four (of the index’s 27 total) bear markets have seen larger declines than that over their full course from peak to trough. Further, it would require a nearly 50% drop to return to pre-COVID highs made on 2/19/20. There have only been three bear markets to see 50%+ drops in the S&P’s history. And finally, even if the S&P mirrored its worst bear market ever (a 62% decline during the 1931-1932 bear), the index would still be above its COVID Crash low from six years ago, which is 66% below current levels.
Like this analysis? Join our premium members by starting a trial today! Click below for details on how to sign up:

Mar 23, 2026
Our Sector Snapshot provides a quick yet comprehensive look at several technical and fundamental readings across each of the eleven major sectors in addition to the S&P 500. Last week, we unveiled a freshened-up look for the cover page of our Sector Snapshot (shown below):
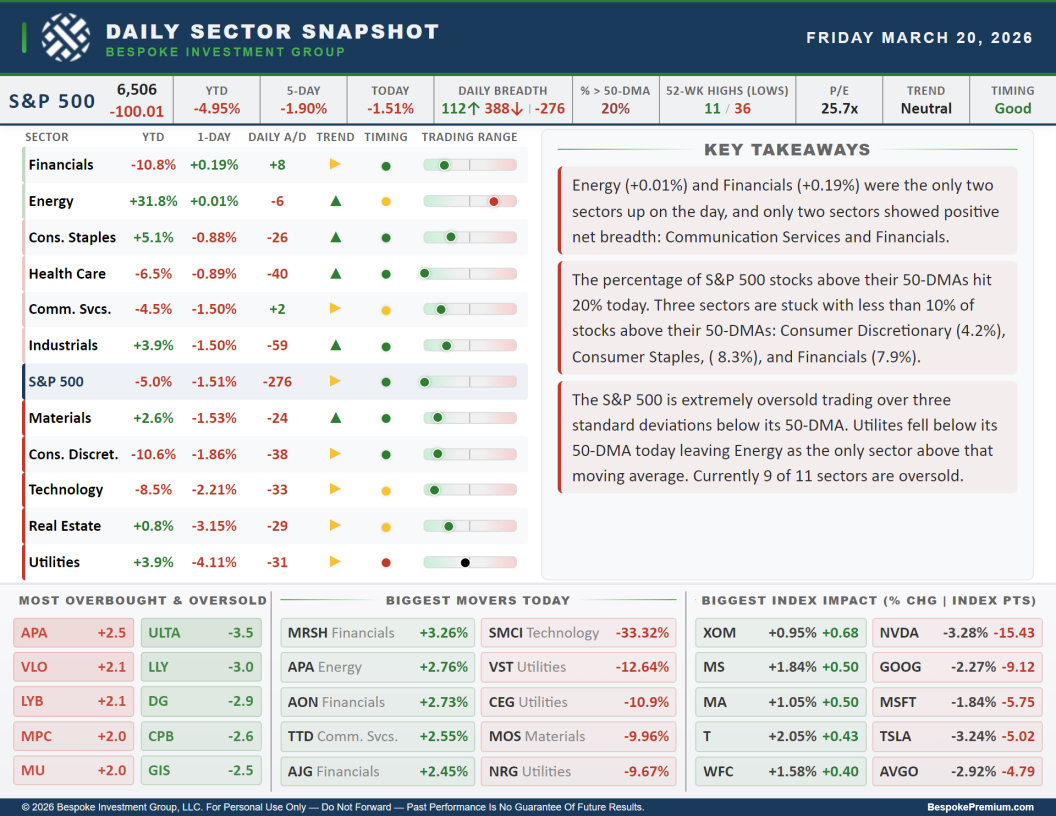
In the images below, we will work from top to bottom and left to right of the cover page to highlight each section.
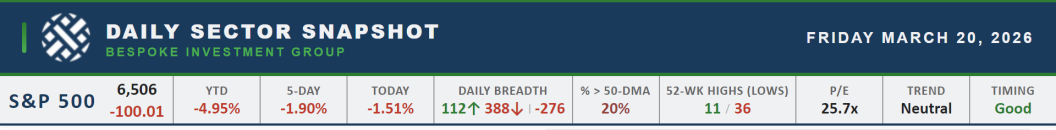
At the top of the page is a ticker tape of performance and breadth readings for the S&P 500. Moving left to right, we show the index’s price level (and daily change in terms of index points directly below) followed by its year to date, one week, and daily percentage changes. Next up are breadth readings including the daily number of advancing (in green) and declining (in red) stocks in addition to the net reading (number of advancers minus decliners). We then show the percentage of stocks trading above their 50-DMAs and the number of S&P 500 constituents that hit new 52-week highs and lows. Finally, on the righthand end of the strip, we show the updated price-to-earnings ratio and the trend and timing scores per our Trend Analyzer tool.
The next section is a matrix of the eleven S&P 500 sectors showing year to date and daily performance, the daily net advance/decline reading, a trend score (red arrows for downtrends, yellow arrows for sideways trends, and green arrows for uptrends), timing scores (red dots for poor, yellow dots for neutral, and green dots for good), and finally, a trading range chart. These bars’ midpoints are the sector’s 50-DMA, with the dot showing how far (in standard deviations) price is currently trading from that moving average. Readings further to the left or right indicate more extreme oversold or overbought readings, respectively. This matrix is sorted from best to worst based on one-day percentage change.
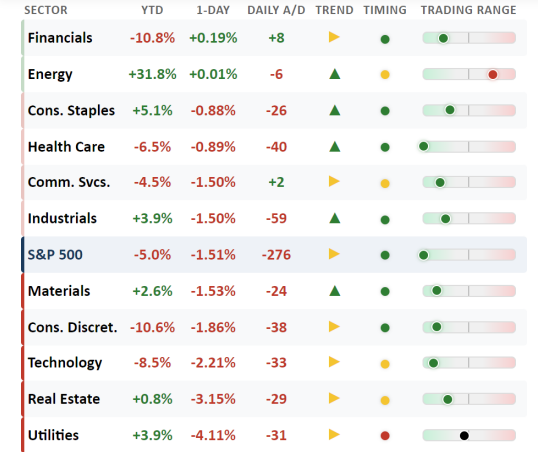
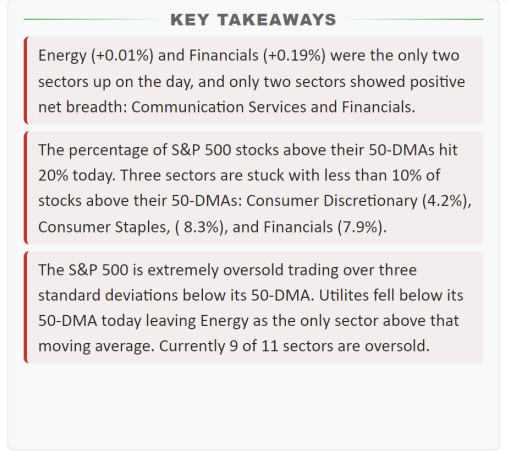
To the right of the sector matrix are key takeaways from recent sector price action. Refreshed daily, these notes parse through the indicators tracked throughout the full Sector Snapshot to highlight the most noteworthy findings.
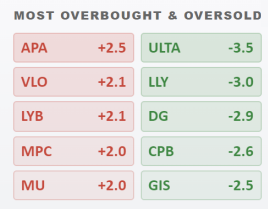
The bottom third of the page is dedicated to showing individual S&P 500 members that are standing out in various ways. The bottom left table shows the five S&P 500 stocks that are most overbought and oversold. This section includes tickers and how far each one is trading (in standard deviations) above or below its 50-DMA. Tickers in red are the most overbought stocks in the index, while tickers in green are the most oversold.
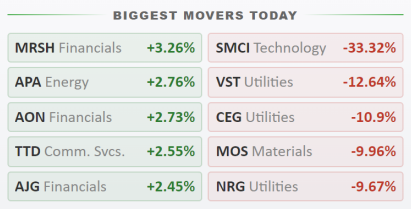
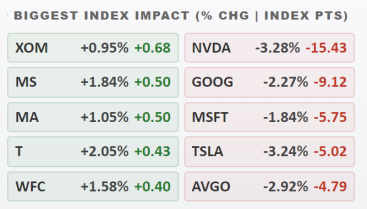
The bottom middle section highlights the S&P 500’s five biggest winners and losers each day:
And finally, the bottom right section shows the five stocks that had the largest positive and negative impact on S&P 500 performance that day. For each of these stocks, its daily percentage change is shown in grey, while the numbers in green and red show the impact (in points) each stock had on the S&P 500’s price move that day.
If you have any questions or ideas for our daily Sector Snapshot, let us know!
Want to gain access to the Sector Snapshot? Join our premium or all access members by starting a trial today! Click below for details on how to sign up:
Mar 19, 2026
Log-in here if you’re a member with access to the Closer.
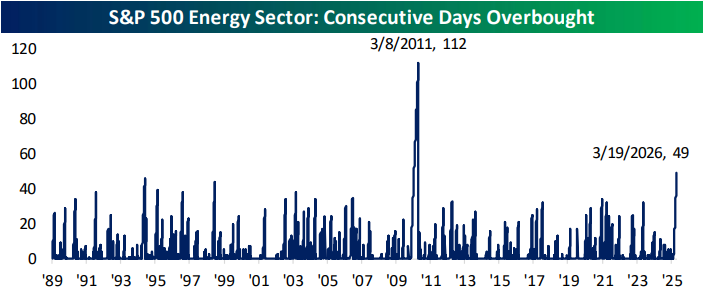
- The Energy sector has now traded in overbought territory for 49 consecutive trading days; the second longest streak of overbought readings on record.
- Intraday, crude oil futures continue to be driven by extreme lurches in positioning and weak liquidity.
- Data from the Federal Reserve’s Flow of Funds report showed that the corporate financing gap remains negative despite the boom in AI investment.
See today’s full post-market Closer and everything else Bespoke publishes by starting a 14-day trial to Bespoke Institutional today!
Mar 19, 2026
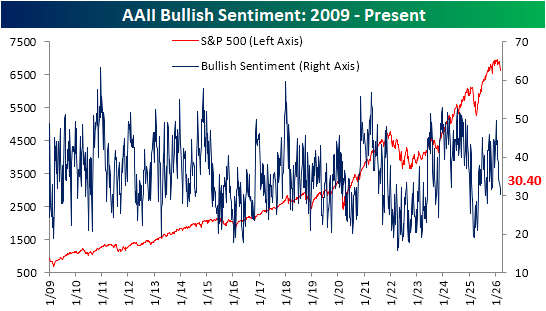
As if news headlines and price action haven’t been signals enough, investor sentiment readings are also pointing toward negative outlooks in the wake of the conflict in the Middle East. The American Association of Individual Investors (AAII) weekly sentiment survey saw only 30.4% of respondents report bullish sentiment this week. That is the lowest level since the week of 9/11/25, when it registered 28%. Additionally, as we first highlighted in today’s Morning Lineup, the 1.5 percentage point drop this week marked the seventh consecutive weekly decline in bullish sentiment, which ties another 7-week-long streak from May 1993.
Given the drop in bulls, bearish sentiment has continued to surge. This week, the reading rose another 5.6 percentage points to 52%. That is the highest reading since last May, when it was at 59.3%. Throughout the survey’s history since 1987, less than 5% of weekly readings have seen more than half of respondents report as bearish.
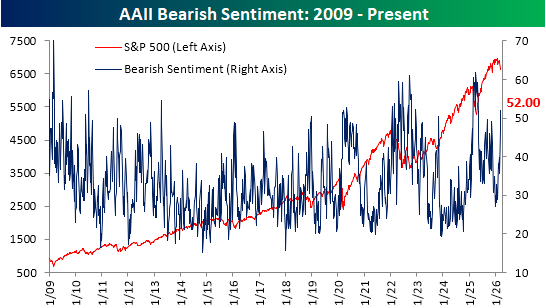
With inverse moves in bulls and bears, the bull-bear spread fell to -21.6. That narrowly surpasses the previous local low of -21.5 from the week of 9/11/25, registering the worst reading since last May.
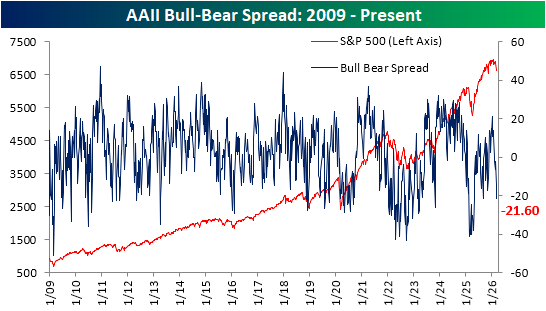
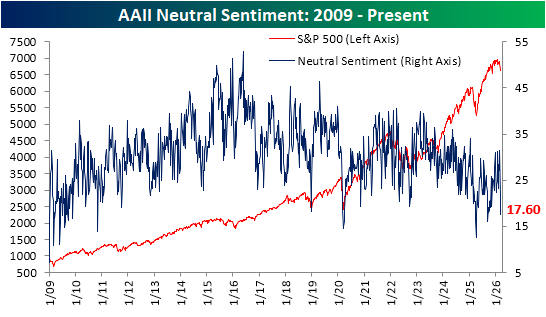
We would also note that not only has there been a big move toward bearish sentiment due to lost bullishness, but a big drop in those reporting neutral sentiment has also been a factor. Only two weeks ago, 31.4% of respondents reported neutral sentiment for the highest reading since January 2025. In the two weeks since then, it has fallen to 17.%, which ranks in the 4th percentile of all periods on record, and is the lowest since a reading of 16% last September.
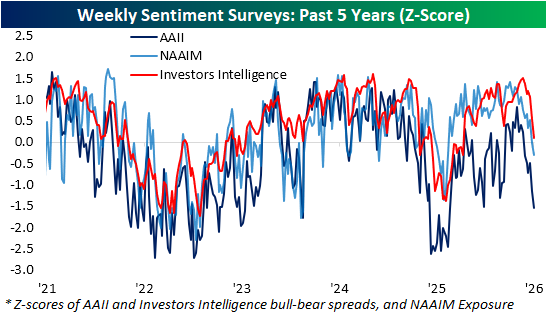
In other words, sentiment has turned overwhelmingly bearish. That is also reflected in other surveys like the Investors’ Intelligence and NAAIM Exposure index readings. The latter now indicates the lowest level of long exposure to equities since last spring, and that reading is now also below the historical average. The Investors’ Intelligence survey is still marginally bullish relative to historical norms, although it too is quickly approaching bearish readings.
Like this analysis? Join our premium members by starting a trial today! Click below for details on how to sign up: