Chart of the Day: Magnificent Valuations
This content is for members onlyThe Closer – 200-DMA Stop, Terrible 2s, 5 Fed – 3/24/26
Log-in here if you’re a member with access to the Closer.
- Throughout the S&P 500’s history, a hypothetical strategy that goes to cash when the index falls below its 200-DMA has outperformed.
- Today’s 2-year note auction saw terrible demand; similar to other coupon sales so far in March.
- Regional Fed surveys showed that there may have been supply chain stress even before the war with Iran began.
See today’s full post-market Closer and everything else Bespoke publishes by starting a 14-day trial to Bespoke Institutional today!
The Closer – Vol, Risk Parity, Construction – 3/23/26
Log-in here if you’re a member with access to the Closer.
- While the VIX continues to trend higher, there are some other signs indicating that volatility may have peaked.
- Gold has seen a large rise in leverage over the last four weeks whereas the drop in corporate bonds leverage has been 3 standard deviation move.
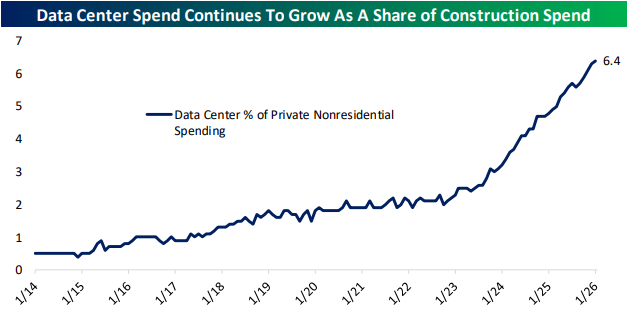
- Data center spending climbed to 6.4% of private nonresidential construction spending in January.
See today’s full post-market Closer and everything else Bespoke publishes by starting a 14-day trial to Bespoke Institutional today!