Magnificent Bears
While equities are struggling to pick a direction as of midday, the weakness at the end of last week has marked fresh lows for the broad market and some of the most influential names: the Magnificent Seven. This group of mega-cap Tech names – Apple (AAPL), Amazon (AMZN), Alphabet (GOOGL), Meta (META), Microsoft (MSFT), NVIDIA (NVDA), and Tesla (TSLA) – officially entered correction in the middle of the month, and through last week’s lows, it was approaching bear market territory. Since the October 29th high, the group has fallen 17.4% through Friday’s low.
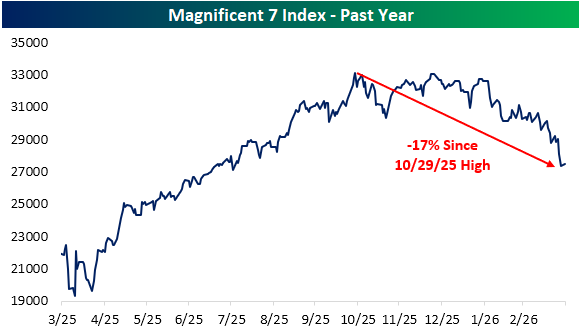
While it is not yet a bear market, this is now the most severe drawdown since the tariff tantrum last spring and the 2022 bear market before that. And although the index itself isn’t in a bear market, five of the seven underlying stocks are now officially in a bear after Amazon (AMZN) and Alphabet (GOOGL) both closed down over 20% from their highs last Friday.
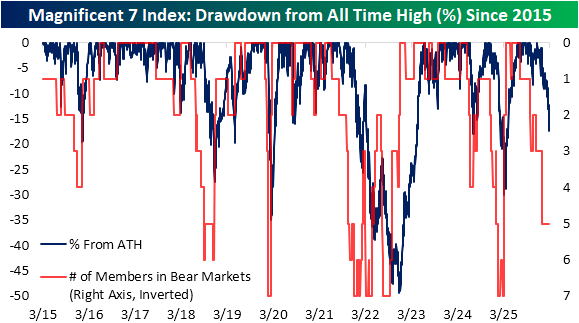
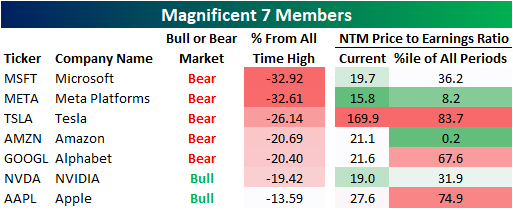
In the table below, we show the seven members of this group, if they are currently in a bull or bear market, how far they are from all time highs, and where their valuations stand after that move. Again, all of these stocks are in bear markets now with the exception of NVIDIA (NVDA) and Apple (AAPL). Of those two, NVDA is very close to joining the rest of the pack as it is now down 19.4%. AAPL would need to fall much further as it is down only 13.6%. Conversely, Microsoft (MSFT) and Meta (META) have led the way lower with declines eclipsing 30% versus their respective peaks.
Last week (see here and here) we discussed how the Tech sector and adjacent areas like the Magnificent 7 may have seen stagnant to outright weak price action in recent months, but that has resulted in falling multiples as estimates remain optimistic for the underlying businesses for the year ahead. As such, currently four of the seven Magnificent 7 stocks have a forward price-to-earnings ratio that is below the historical median including extremely discounted levels for the likes of Meta (currently in the 8th percentile) and Amazon (now in the first percentile of readings).
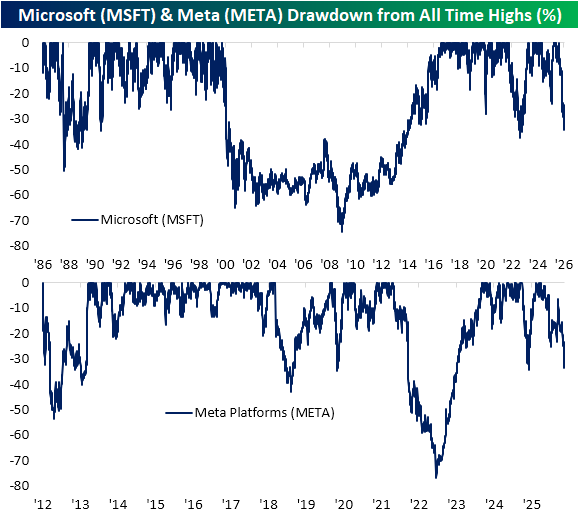
As noted previously, the two biggest decliners of the mega-caps have been MSFT and META. For MSFT, the current drawdown is nearly on par with the total decline seen during the 2022 bear market. Further, that has surpassed the COVID Crash drawdown too.
As for META, the 2022 bear market was far more severe than today’s drop, which is more on par with last spring’s decline.
Like this analysis? Join our premium members by starting a trial today! Click below for details on how to sign up: