UPDATE: Trump 1.0 vs. Trump 2.0
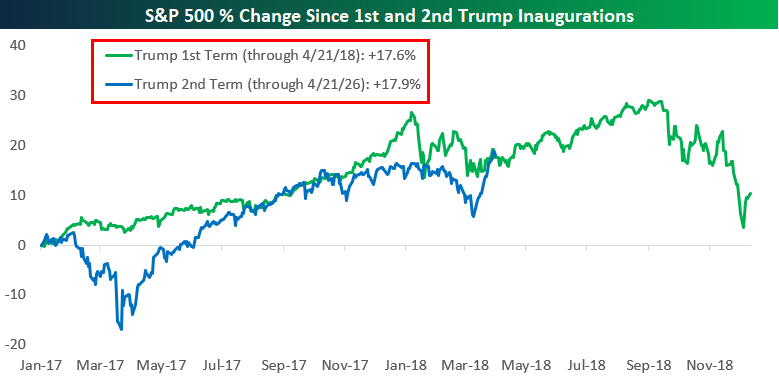
We’re currently 314 trading days into President Trump’s second term, and the S&P 500 is currently up 17.9% since its last close prior to Inauguration Day 2025.
Amazingly, the stock market was essentially up the exact same amount at this point in President Trump’s 1st term!
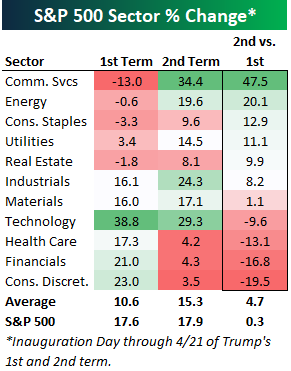
While just 0.3 percentage points separates the S&P 500’s performance at this point in Trump’s 1st and 2nd terms, sector performance has been quite a bit different.
Communication Services is up more than any other sector in Trump’s second term (+34.4%), while it was down 13% at this point in Trump’s first term.
Energy was flat at this point in Trump’s first term, but it has shot up nearly 20% in Trump’s second term.
Technology was the best sector in Trump’s first term through April 21st, and it has been the second best sector during Trump’s second term with a gain of 29.3%.
Three sectors that have been weak relative to their performance during Trump 1.0 are Health Care, Financials, and Consumer Discretionary. All three sectors were up roughly 20% at this point in Trump’s first term, but they’re all only up 3-5% during Trump’s second go-around.
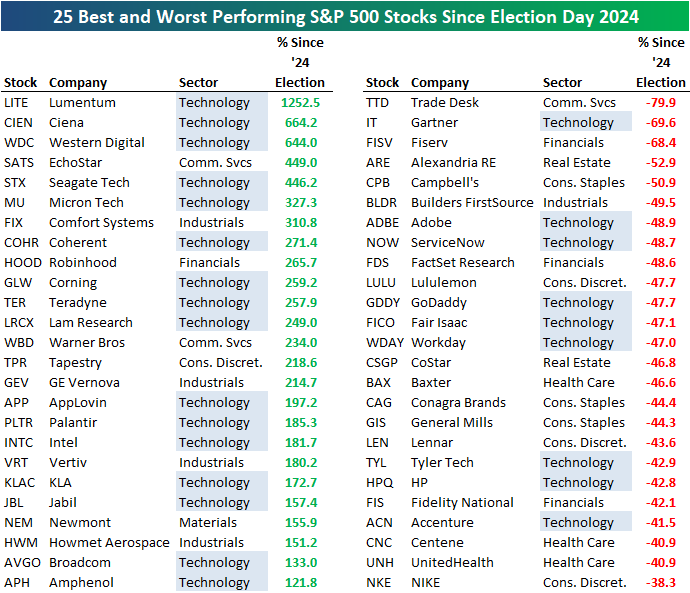
Tech and AI Infrastructure stocks have dominated the list of biggest winners since Trump was re-elected. For the table below, we show the 25 best and worst performing stocks since Election Day 2024 (not Inauguration Day).
Sixteen of the 25 best-performing stocks are from the Tech sector, including the top three, which are all up 600%+: Lumentum (LITE), Ciena (CIEN), and Western Digital (WDC).
Nine of the 25 worst performers are also from the Tech sector, which are names like Gartner (IT), Adobe (ADBE), and ServiceNow (NOW) that are getting crushed due to fears of AI obsolescence.
While politics certainly causes plenty of stress and anxiety for many investors, the biggest winners and losers since Trump’s re-election have been driven mostly by the AI trade, not politics. This is yet another example of why investors should never let politics impact long-term investment decisions.
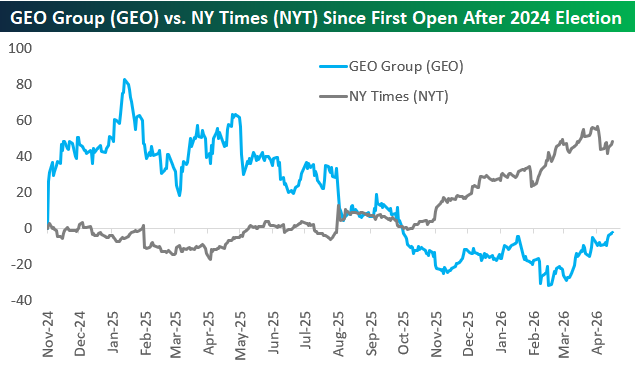
One final chart we wanted to highlight is the performance of GEO Group (GEO) versus New York Times (NYT). For these two names, Trump has been a big driver of performance, but their paths are what’s enlightening.
GEO Group (GEO) is one of the few publicly traded private prison and detention center stocks, and traders bid this name up significantly after Trump won re-election on his promise to crack down on crime and illegal immigration. As you can see in the chart, GEO soared 80% in the first few months after Election Day 2024, but since peaking in early 2025, it has given up all of those gains and then some.
The New York Times (NYT), on the other hand, treaded water in the first six months after Trump’s re-election, but it has done nothing but trade higher since last April.
While traders initially saw GEO as a potential winner during Trump’s second term, the longer-term opportunity was in NYT, which continues to see an uptick in subscriptions.
Sign up for Bespoke’s Think BIG mailing list to receive an interesting market thought like this in your inbox a few times per week. Click here or on the image below to sign up. An email is all we need!