Apr 15, 2026
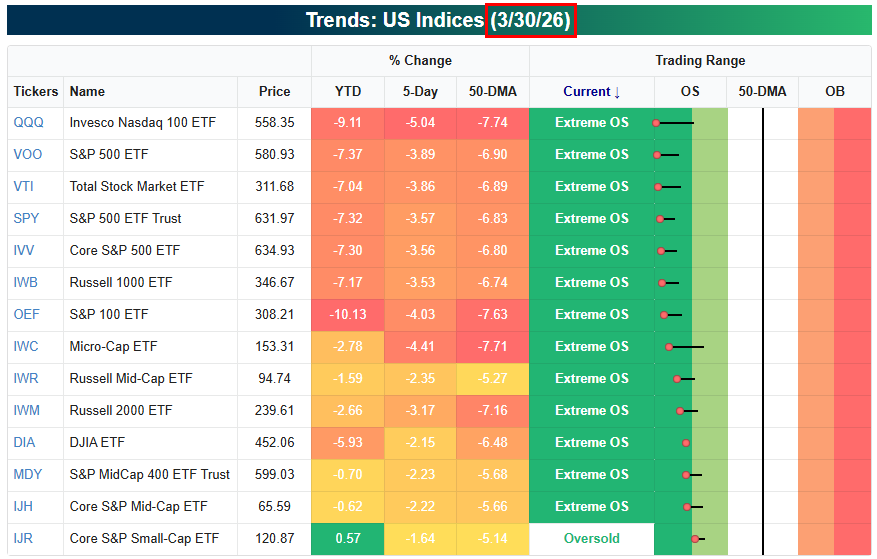
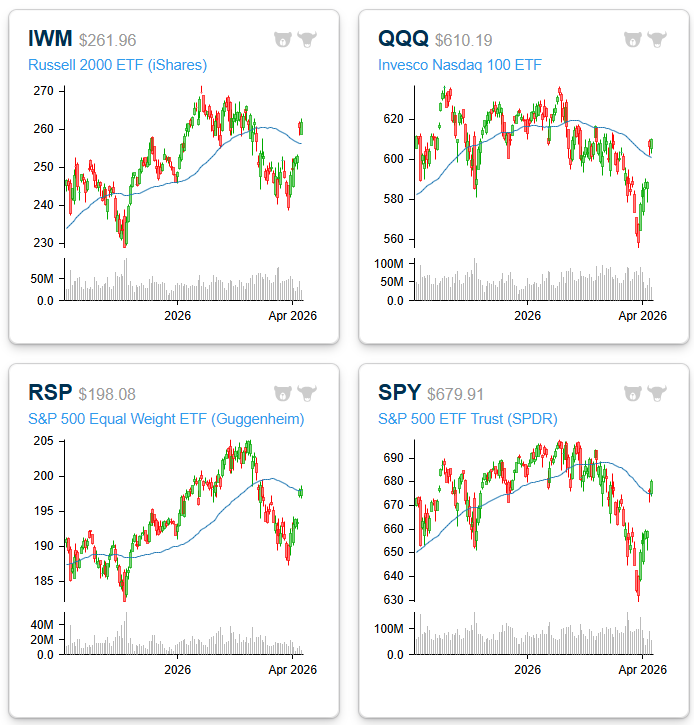
Just over two weeks ago on March 30th, every single key US index ETF that we track in our Trend Analyzer tool (available to Premium members and higher) was oversold, with all but the Dow 30 ETF in extreme oversold territory.
Fear was permeating and bearish sentiment gauges were rising sharply.
Fast forward to two weeks later.
As shown below, these same index ETFs are now all in overbought territory (with the exception of the Dow 30).
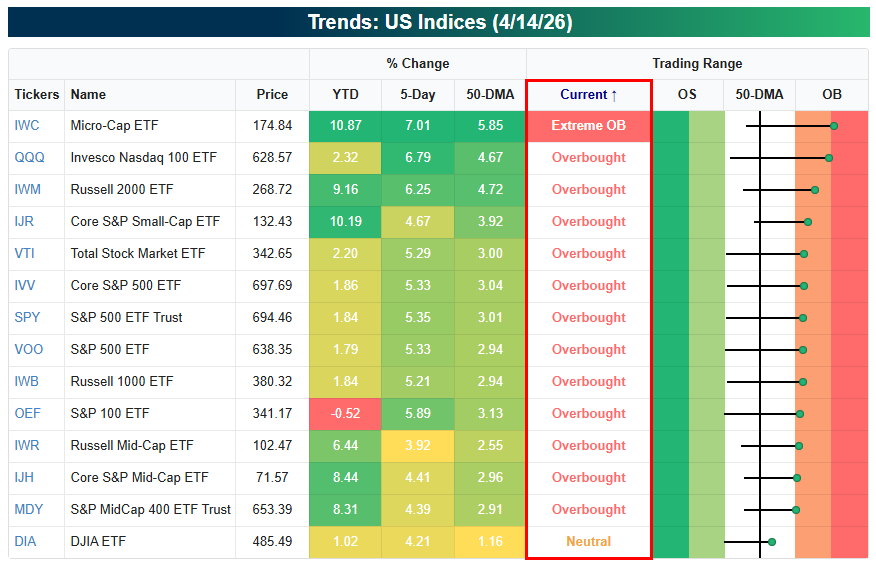
For investors and traders, the action over the last few weeks is a good reminder that markets don’t stay oversold or overbought forever.
If you’re fearful when prices get oversold or ebullient when prices get overbought, try to remind yourself that the script will eventually flip.
Sign up for Bespoke’s Think BIG mailing list to receive an interesting market thought like this in your inbox a few times per week. Click here or on the image below to sign up. An email is all we need!

Apr 13, 2026
This content is for members only
Apr 10, 2026
After a 50%+ run from lows last April through highs in mid-January, the Biotech group has been trending sideways over the last few months.
Biotech hasn’t garnered much attention lately, with all the coverage of the Iran War and the AI Doom trade that’s been taking down software stocks even as AI infrastructure stocks continue to surge.
Below is a look at the iShares Biotech ETF (IBB), both recently (last 12 months) and over the long-term (since 2010). What we see is a group trading sideways right now at a key inflection point.
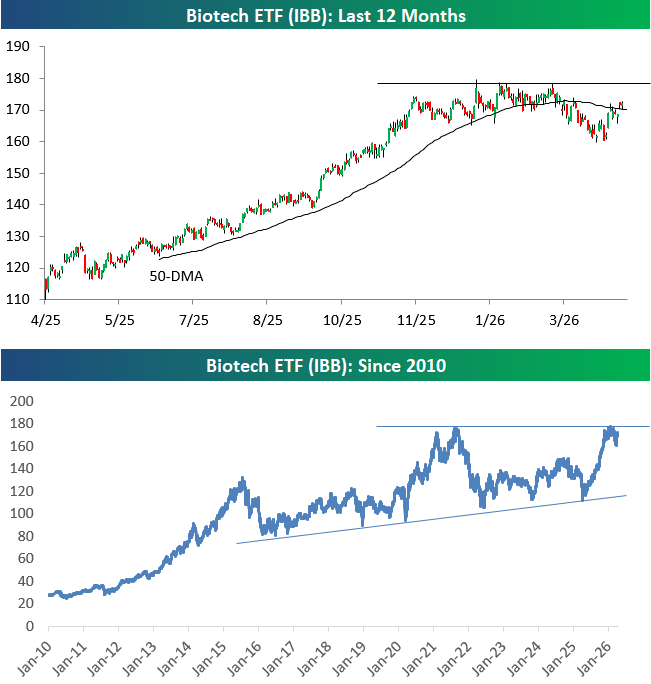
In the short-term, IBB has just managed to re-take its 50-day moving average, but it needs to break out to new highs to resume the uptrend that was in place last year.
Looking longer term, IBB’s rally in the last year ran out of steam at the same level it stopped at back in late 2021 before the broader market entered a nasty bear market.
Putting the short-term and long-term together, if Biotech manages to break out to new highs at some point this year, it would clear a significant resistance hurdle and open the door up for another big leg higher.
If new highs can’t be made soon, the double tops from earlier this year and late 2021 will loom large in the minds of traders.
Sign up for Bespoke’s Think BIG mailing list to receive an interesting market stat like this in your inbox a few times per week. Click here or on the image below to sign up. An email is all we need!
Apr 10, 2026
See what’s driving market performance around the world in today’s Morning Lineup. Bespoke’s Morning Lineup is the best way to start your trading day. Read it now by starting a two-week trial to Bespoke Premium. CLICK HERE to learn more and start your trial.
“The market is a pendulum that forever swings between unsustainable optimism and unjustified pessimism.” – Jason Zweig

Below is a snippet of commentary from today’s Morning Lineup. Start a two-week trial to Bespoke Premium to view the full report.
While the S&P 500 still sits 2.8% below all-time highs, both the Dow Transports and Philadelphia Semiconductor index — two groups seen as “leading” indicators — hit new all-time highs yesterday. The charts below show the breakouts to new highs for these two closely-followed areas of the market.
US equity futures are trading slightly higher this morning as we look to close out the week with five days of gains (and extend the daily win streak to eight dating back to last Tuesday).
Below is a look at the swing we’ve seen from oversold levels last week to back above the 50-DMA for most key US index ETFs:
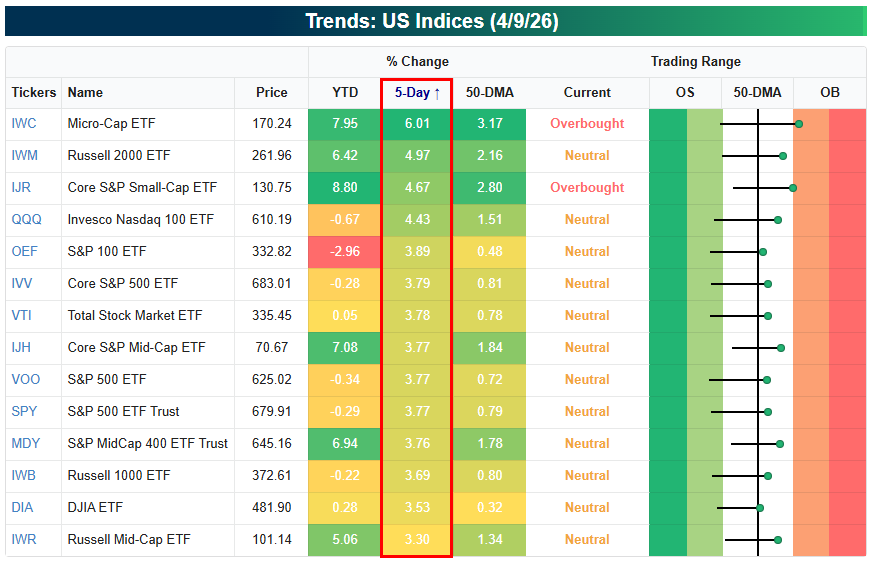
While we’ve seen a nice bounce, price charts for ETFs like SPY, QQQ, and IWM still have work to do to break out of the choppy action seen for many months now.
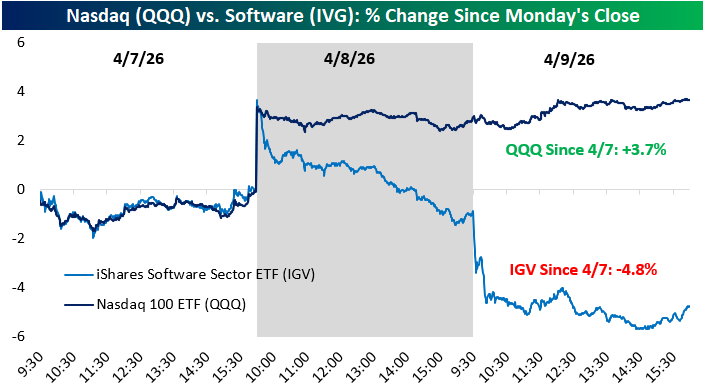
Yesterday was another painful day for the software group, which fell another 3.9% as algos look to exit or short anything at risk of AI obsolescence.
As shown below, IGV is now down 4.8% since Tuesday’s close when the US/Iran ceasefire was announced versus a gain of 3.7% for the broader Nasdaq 100 (QQQ).
Start a two-week trial to Bespoke Premium to continue reading today’s full Morning Lineup.
Apr 9, 2026
For generations of market watchers, the Dow Jones Transportation Index was considered the ultimate leading indicator for the broader market. The idea being that if goods were moving, the economy was humming.
For today’s digital economy, the “leading” torch has been handed to the Semis group, which we labeled “the Transports of the 21st century” years ago.
The logic is the same: semiconductors are the essential inputs that power modern economic activity, from smartphones to data centers to automobiles.
When both of these bellwether indices are breaking out to new all-time highs simultaneously, as they are right now, it’s a signal worth paying attention to.
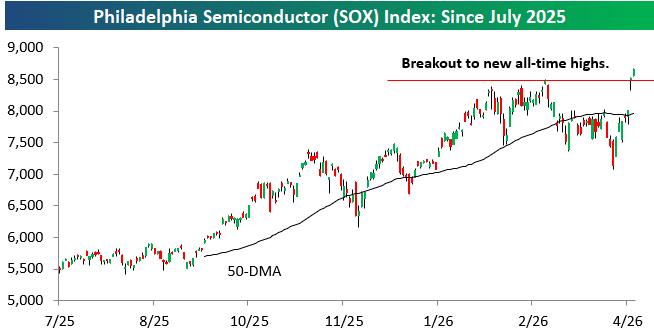
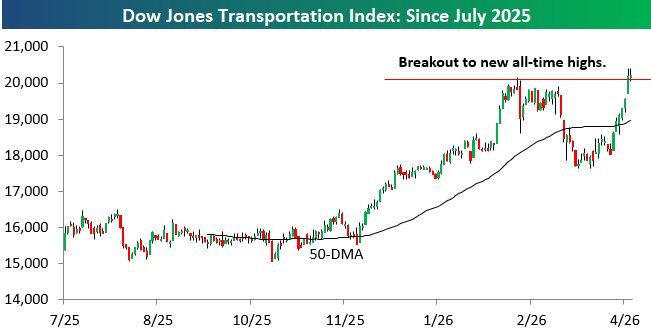
What makes the current setup particularly compelling is that the S&P 500 has not yet confirmed the move, still sitting roughly 2.5% below its own all-time high.
Historically, when leading indicators like the Transports and Semis are making new highs while the broader market lags, it has been viewed as a sign that the index is being pulled higher, not pushed.
The charts for Transports and Semis above show clean breakouts, with the 50-day moving average trending solidly higher beneath price. That is the kind of technical foundation that tends to give bulls confidence.
If the S&P 500 closes the gap as well and confirms with its own breakout, the weight of the evidence will be difficult to argue with.
Sign up for Bespoke’s Think BIG mailing list to receive an interesting market stat like this in your inbox a few times per week. Click here or on the image below to sign up. An email is all we need!
