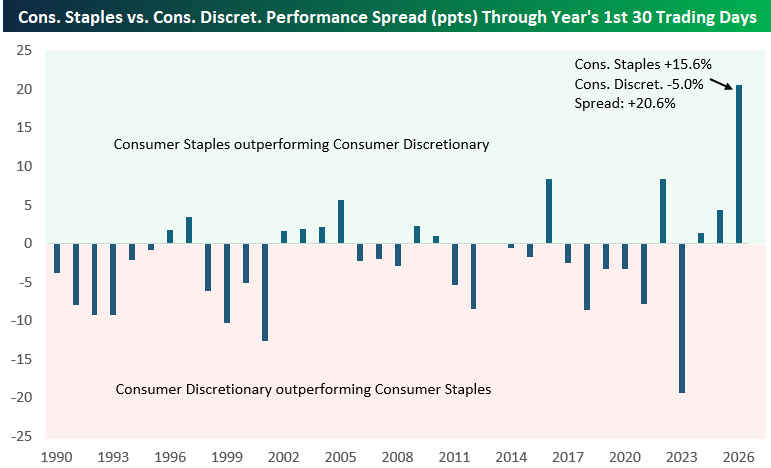
Best Start for Consumer Staples in 35+ Years
Through the first 30 trading days of 2026, the Consumer Staples sector gained 15.6%. That’s easily the best start to a year for Staples since at least 1990 (when our daily sector price data begins). Prior to 2026, the strongest start to a year for Staples was a 9.2% gain through the first 30 trading days of 1997.
While Consumer Staples has been soaring, the cyclical Consumer Discretionary sector has been declining, falling 5% through the year’s first 30 trading days.
With Staples up 15% and Discretionary down 5%, the 20 percentage point spread between the two is a new record through 30 trading days (going back to 1990). No other years have been even remotely close.
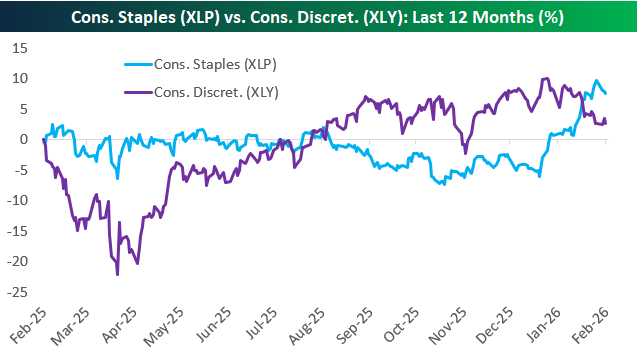
The surge in Staples to start 2026 has left the defensive Staples sector ETF (XLP) up more than Consumer Discretionary (XLY) over the last twelve months. The chart below resembles the classic “tortoise and the hare” race, doesn’t it? Staples slowly moved sideways throughout the first half of 2025 and then slowed even more in the last five months of the year. Discretionary plummeted to start 2025 during the tariff tantrum but then decided to start competing after the first quarter mile. Discretionary surged past Staples last August and didn’t look back. That is until the calendar year turned to 2026. While Discretionary took a breather, Staples came from behind down the final stretch to win the race! Of course, in markets, the race is never over, but you get the point.
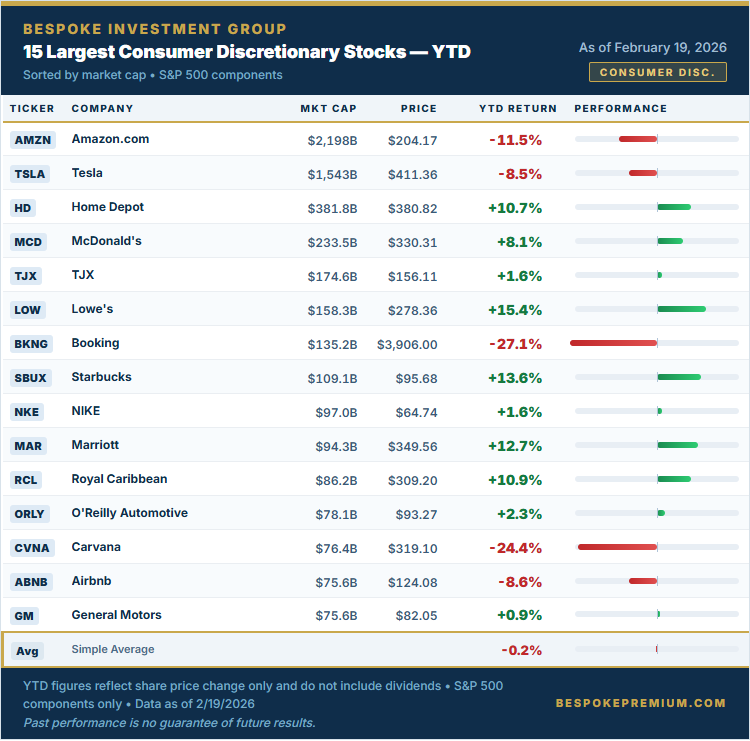
The reason Consumer Discretionary has been so weak is because its two largest stocks have struggled to start the year. As shown below, Amazon (AMZN) is down 11.5% YTD, while Tesla (TSLA) is down 8.5%. These two stocks have a combined market cap that’s nearly $1 trillion bigger than the combined market cap of the remaining 46 stocks in the sector!
Of the 15 largest Consumer Discretionary stocks shown in the graphic below, ten are actually up on the year.
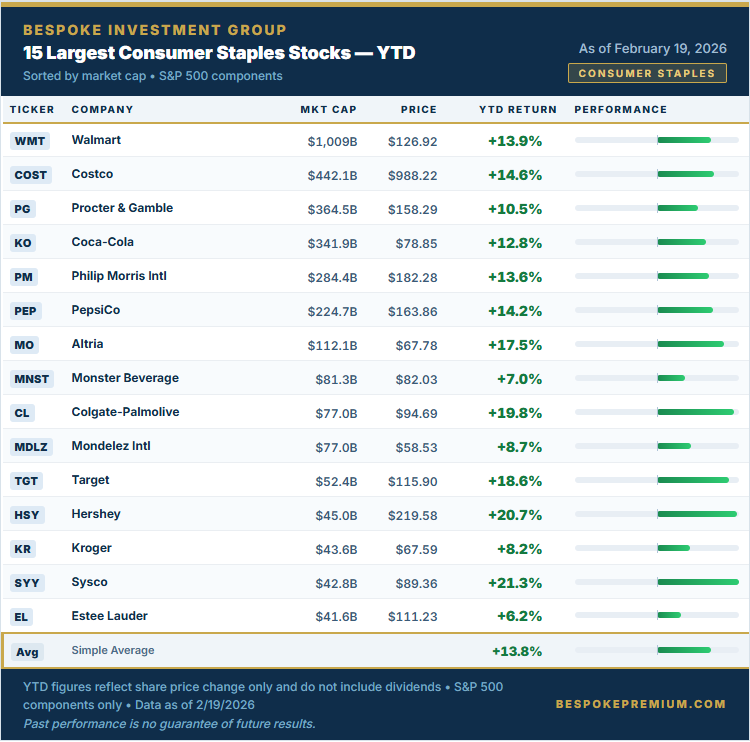
The performance of the 15 largest Consumer Staples stocks to start the year has been eye-popping. Each of the seven largest Consumer Staples stocks are up 10%+ on the year, while all 15 stocks listed are in the green.
There’s a way to get around the top-heaviness of the market, though, and that’s by focusing on the equal-weight versions of sector and index ETFs.
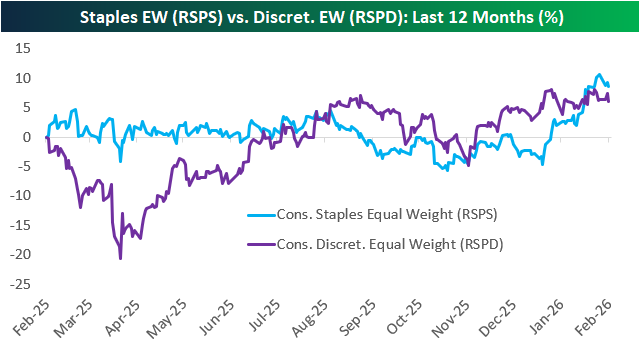
As shown below, the equal-weight versions of Consumer Staples (RSPS) and Consumer Discretionary (RSPD) are much more closely aligned over the past year. That’s because the average stock in the Consumer Discretionary sector has done better than Amazon (AMZN) and Tesla (TSLA) in recent months.
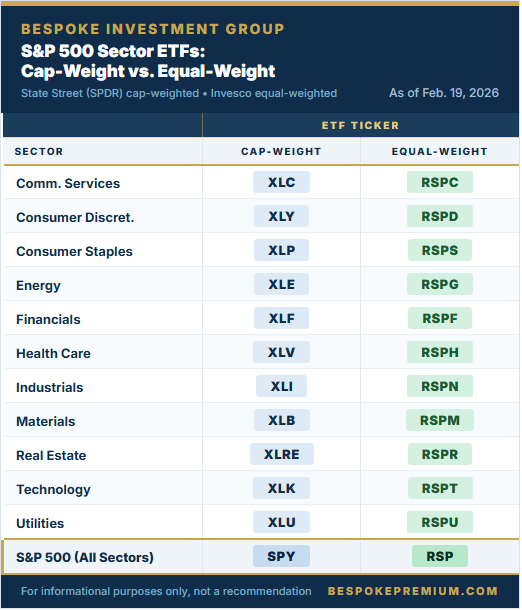
If you’d like to simply bet on the average stock in a sector rather than having more exposure to the biggest stocks, we created the graphic below that lists ETF options for both cap-weighted and equal-weighted S&P 500 sectors.
Like this analysis? Join our Think BIG mailing list to receive an interesting market stat in your inbox multiple times per week. Click the image below and enter your email to join:

Bespoke Baskets Update – February 2026
This content is for members onlyBiggest S&P 500 Winners Last 5, 10, 20 Years
The S&P 500’s annualized total return over the last five years has been roughly 13.5%, but the average stock currently in the index has seen an annualized total return about 2.6 percentage points less at just 10.9%.
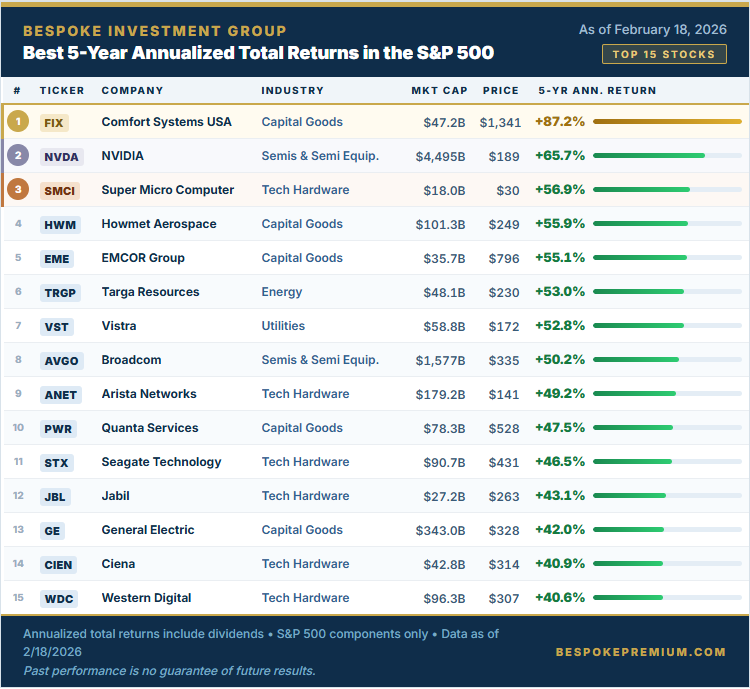
Just over 20% of stocks in the S&P 500 have posted annualized returns of 20%+ over the last five years, but below is a list of the 15 companies with the strongest 5-year returns. Each of these stocks has gained more than 40% annually since early 2021!
While NVIDIA (NVDA) is by far the biggest stock on the list of five-year winners and ranks second, Comfort Systems (FIX) – which installs HVAC and building systems – gets the gold with a 5-year annualized total return of 87.2%. Super Micro (SMCI) gets the bronze at 56.9%, followed by Howmet Aerospace (HWM) and EMCOR (EME). Other notables on the list of 5-year winners include Broadcom (AVGO), Arista Networks (ANET), Quanta (PWR), Seagate (STX), and General Electric (GE). While GE struggled during the first 20 years of this century, it has lit fire during the 2020s.
We also looked at returns over the last ten and twenty years to find stocks that have been the most consistent winners over lengthy time frames.
As mentioned earlier, the S&P 500 has returned 13.5% annually over the last five years. Over the last ten years, the index has returned 15.6% annually, while it has gained 10.8% annually over the last twenty years.
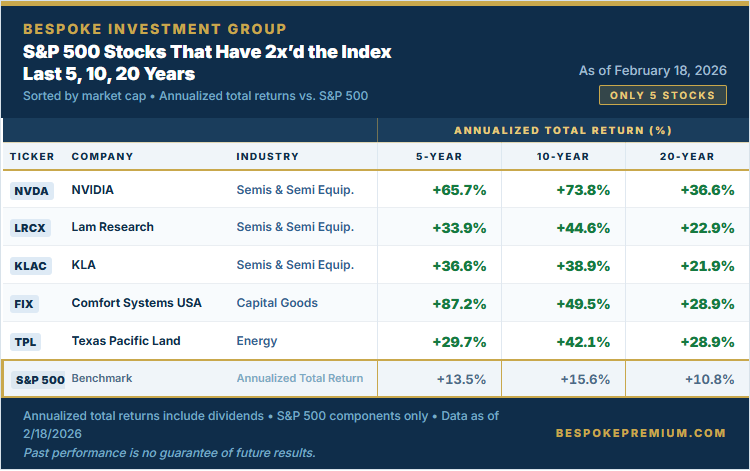
In the S&P right now, there are only five stocks that have doubled the index annually over the last five, ten, and twenty years. These five stocks are shown below sorted by current market cap.
Three semiconductor stocks make up the list of five (NVDA, LRCX, KLAC), while the other two are the aforementioned Comfort Systems (FIX) and an Energy stock: Texas Pacific Land (TPL).
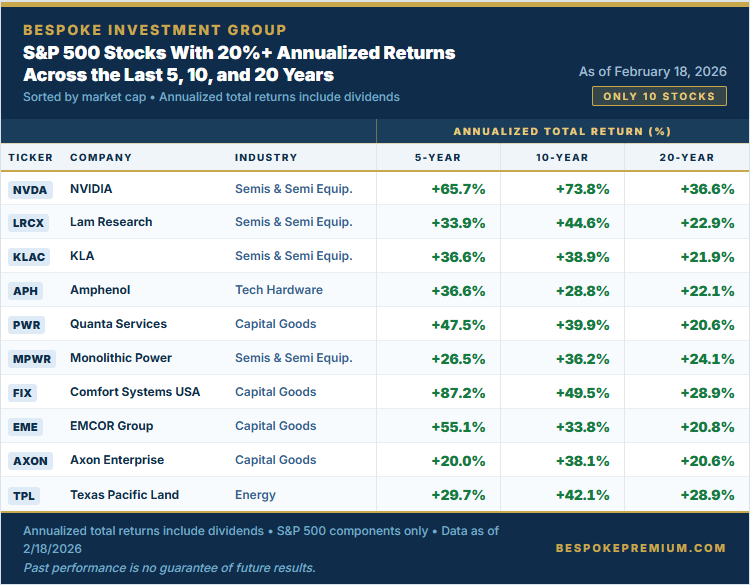
While there are only five S&P 500 stocks that have doubled the return of the index itself over the last five, ten, and twenty years, there are ten stocks that have posted 20%+ annualized returns over all three time frames.
These ten stocks are highlighted below, once again led by NVIDIA (NVDA), Lam Research (LRCX), and KLA (KLAC). Additional stocks that have yet to be mentioned are Amphenol (APH), Monolithic Power (MPWR), and Axon Enterprise (AXON).
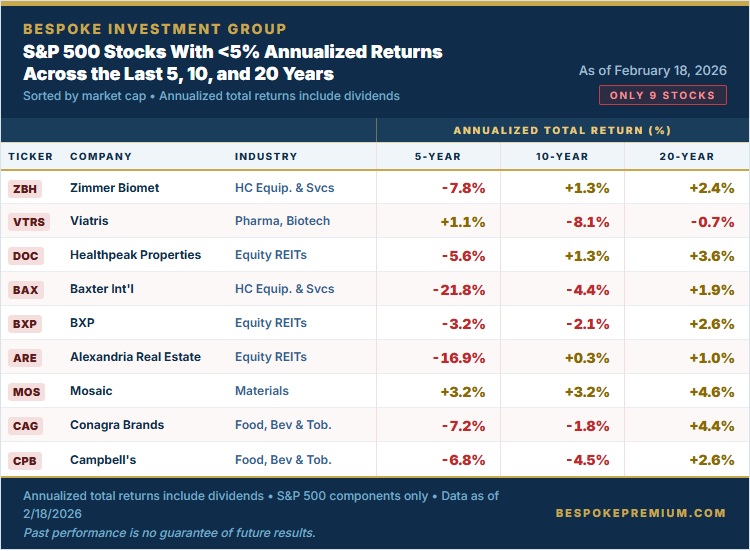
So far we have only discussed winners, but we’ll close with a list of S&P 500 stocks that have struggled mightily in the last two decades. In the index right now, there are nine stocks that have posted annualized total returns of less than 5% over each of the last five, ten, and twenty years.
Some of the more well-known names on the list include Zimmer (ZBH), Baxter (BAX), Conagra (CAG), and Campbell’s (CPB).
Like this analysis? Gain access to all of our daily stock market research by starting a trial today. Click the image below for details:

Bespoke’s Consumer Pulse Report – February 2026
Bespoke’s Consumer Pulse Report is an analysis of a huge consumer survey that we run each month. Our goal with this survey is to track trends across the economic and financial landscape in the US. Using the results from our proprietary monthly survey, we dissect and analyze all of the data and publish the Consumer Pulse Report, which we sell access to on a subscription basis. Sign up for a 30-day free trial to our Bespoke Consumer Pulse subscription service. With a trial, you’ll get coverage of consumer electronics, social media, streaming media, retail, autos, and much more. The report also has numerous proprietary US economic data points that are extremely timely and useful for investors.
We’ve just released our most recent monthly report to Pulse subscribers, and it’s definitely worth the read if you’re curious about the health of the consumer in the current market environment. Start a 30-day free trial for a full breakdown of all of our proprietary Pulse economic indicators.
