Tech Sector Overbought for 46 Trading Days and Counting
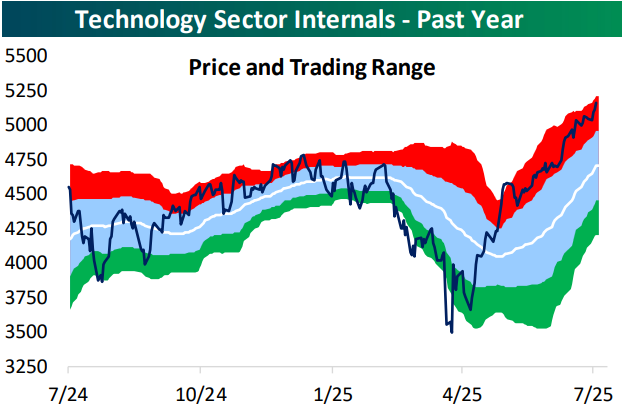
Below is a look at a one-year price chart of the S&P 500 Technology sector. The white line represents the sector’s 50-day moving average, while the light blue shading represents its “normal” trading range, which is a band that’s one standard deviation above and below the 50-DMA. The red shading is one to two standard deviations above the 50-DMA, which we consider “overbought” territory, and anything above the top of the red band is more than two standard deviations above the 50-day. The green shading is the opposite of the red zone: one to two standard deviations below the 50-DMA, which we consider “oversold.”
The Tech sector has now rallied 45% since its low point in early April, leaving it at all-time highs. The sector has also now closed in “overbought” territory for 46 straight trading days (heading into Friday).
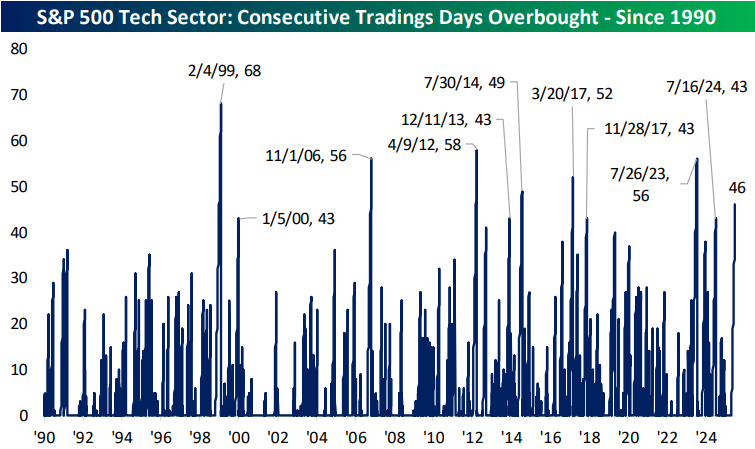
This is the 11th time since 1990 that the Tech sector has closed in overbought territory for at least 40 straight trading days. Yesterday we looked at how the sector has done going forward after prior lengthy overbought streaks in our post-market macro note, The Closer. You can read that report with proper access here.
The longest the Tech sector has remained in overbought territory is the 68-trading day streak that ended in February 1999. At its current level, the sector would need to fall 3.5% for the “overbought” streak to end, so unless we get a big drop early next week, it looks like the current streak will make it to the 50-day mark.

No Sign of Investors Fleeing “US Exceptionalism”
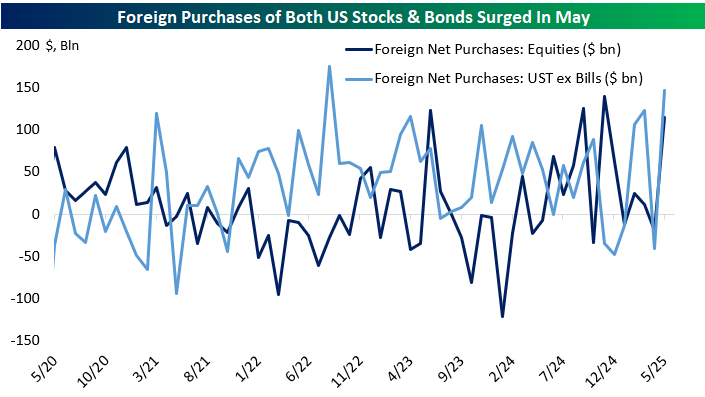
After the close yesterday, the US Treasury reported the largest inflow of foreign capital to that market (net purchases) since 2022, obliterating the narrative that foreign investors are fleeing Treasuries (or US assets generally) due to concerns over political risk or as a response to tariffs. Adding to that news was a large inflow to US stocks, similar in magnitude to the ones we saw last fall. While there was panic about the end of the “US exceptionalism” trade back in April, for now, there’s no sign in the data that foreign investors are fleeing.
Nasdaq 100 (QQQ): 2025 vs. 2020-2024
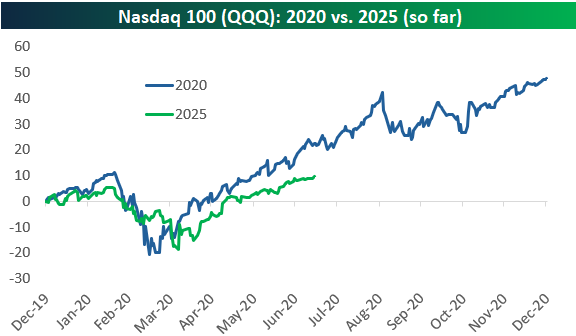
The mega-cap Tech-heavy Nasdaq 100 (QQQ) was sitting on a year-to-date gain of 10% through 2025’s first 134 trading days (through 7/17).
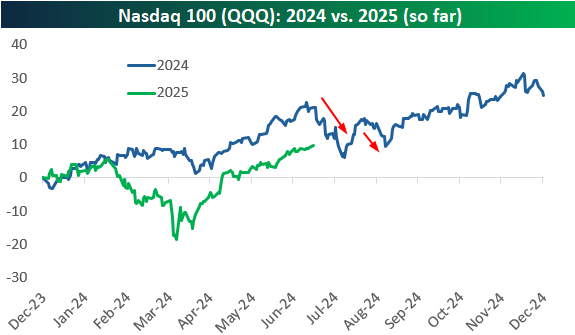
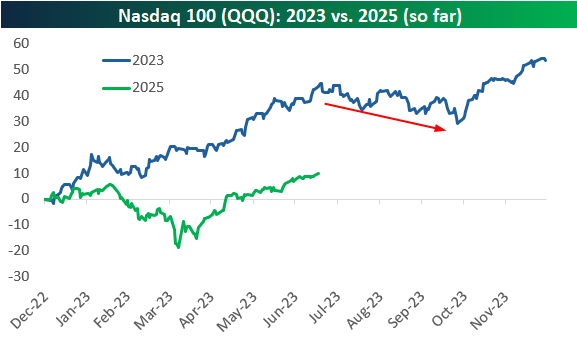
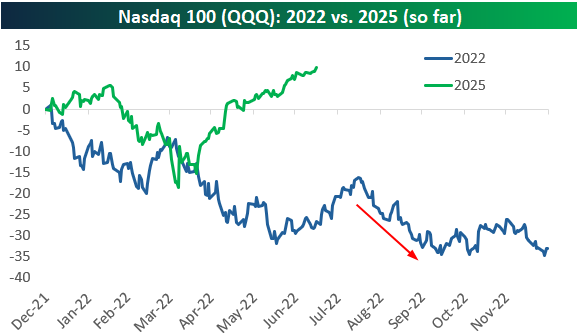
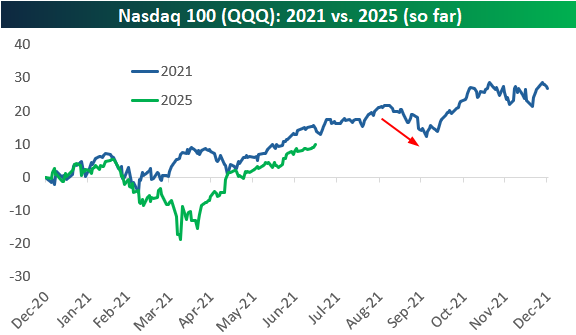
In the charts below, we compare QQQ’s action so far in 2025 to every other year so far this decade. Notably, throughout the 2020s, we’ve seen quite a few sell-offs at some point in Q3, with declines beginning in late July in each of the last two years.
At this point in 2024, QQQ was up 21% year-to-date, or more than twice the 10% gain it has this year. But last year, we also saw a nasty drop that began in mid-July just as the Q2 earnings season was getting started and the 2024 Presidential Election started to ramp up. President Biden getting replaced by VP Harris, and the assassination attempt on President Trump increased market volatility, but QQQ eventually resolved higher by the time September rolled around.
In 2023, QQQ was up a huge 43.7% year-to-date as of July 17th as investors clamored for AI stocks after ChatGPT was released in late 2022. QQQ would end up peaking on July 19th, however, and it went on to fall 10% from that point through its low in late October 2023. We then saw a surge in the final two months of the year for a full-year gain of more than 50% for QQQ in 2023.
Things were dark at this point in 2022. ChatGPT still wasn’t a thing in July 2022, and the Nasdaq 100 (QQQ) was down 26.6% year-to-date at the time. The chart of QQQ this year looked somewhat similar to 2022 through April at least, but from there, the similarities end.
At this point in 2021, COVID was still “a thing” for most investors, but we were also in the midst of a crypto and meme-stock boom that would last through the end of 2021. While QQQ didn’t run into trouble in July or August of 2021, it stumbled a bit in September as rising inflation and “bubble-like” action in stocks really came into view.
Finally, we get to 2020. So far at least, 2025 looks most similar to 2020 for QQQ, as the COVID Crash of 2020 and the Tariff Crash of 2025 saw remarkably similar action. If the 2020 pattern continues to track, we’ve got more room to run for a couple more months before some weakness in the fall, followed by a rally during the two-month holiday stretch to end the year.
As always, past performance is not indicative of future results, but we find it fascinating how similar some years look with others, as well as some of the seasonal trends that seem to always show up.
Trump 1.0 vs. 2.0: Back on Track?
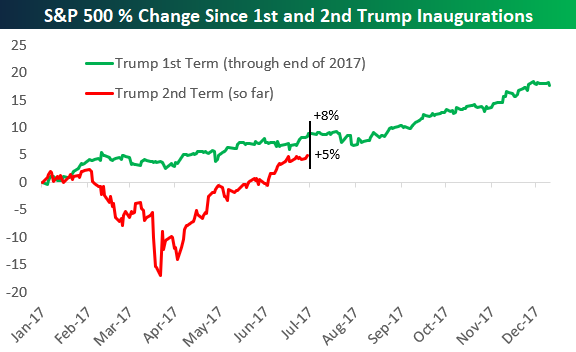
Back on April 8th, the S&P 500 was down 16.9% in the 55 trading days since Inauguration Day on January 20th, but as shown below, the index has recovered all of its initial losses and is currently up 5% since President Trump re-took office. What a comeback!
At this point in Trump’s first term back in July 2017, the S&P was sitting on a gain of 8% since Inauguration Day.
Back in 2017, we saw stocks pull back a bit in August but then explode higher from September through December, and the S&P ended up posting a gain of 18% from Inauguration Day 2017 through the end of that year. We’ll have to wait and see what the rest of 2025 has in store, but either way, the market has seen an absolutely remarkable comeback from the depths of the Tariff Crash just a few months ago.
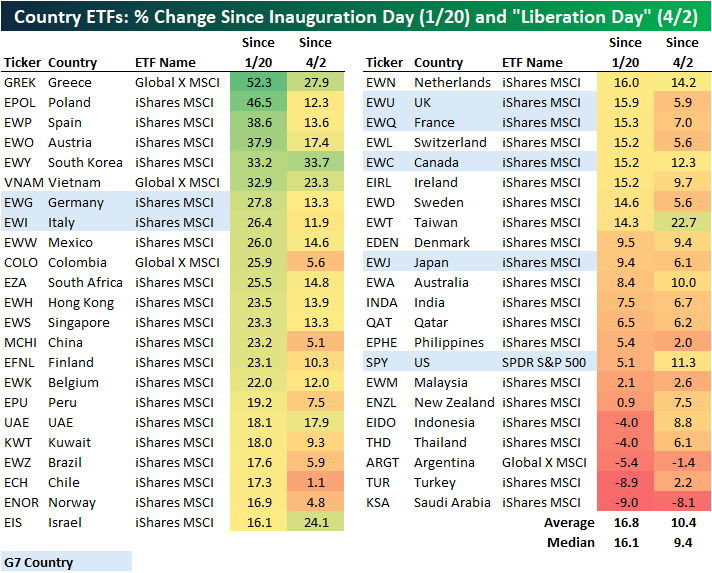
Even with the S&P back to new highs and up 5% since Trump’s 2nd term began, the US is near the bottom of the pack in terms of country by country stock market performance since Inauguration Day. Below is an updated look at the performance of 45 country ETFs traded on US exchanges since Inauguration Day as well as since Trump’s “Liberation Day” tariff announcements in the White House Rose Garden on April 2nd.
The average country ETF is up 16.8% since Trump re-took office, so the US (SPY) is underperforming that average by more than ten percentage points. The US is also still the worst performing of the G7 country ETFs since Inauguration Day, although it’s up the fourth most of the G7 countries since April 2nd.
There are six country ETFs that are up 30%+ since Inauguration Day back in January: Greece (GREK), Poland (EPOL), Spain (EWP), Austria (EWO), South Korea (EWY), and Vietnam (VNAM). On the other end of the spectrum, there are five country ETFs in the red since Inauguration Day: Indonesia (EIDO), Thailand (THD), Argentina (ARGT), Turkey (TUR), and Saudi Arabia (KSA).