Jul 29, 2025
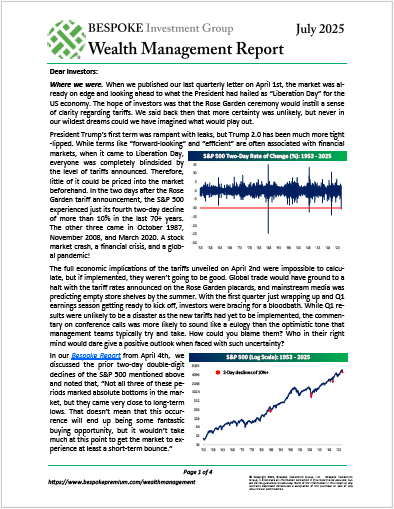
Please click here or on the link below to read our latest quarterly Wealth Management Report. You can learn more about Bespoke’s wealth management services available to investors here or by calling our office at 914-315-1248.
Below are links to prior quarterly Wealth Management Reports:
Bespoke WMR Q1 2025
Bespoke WMR Q4 2024
Jul 28, 2025
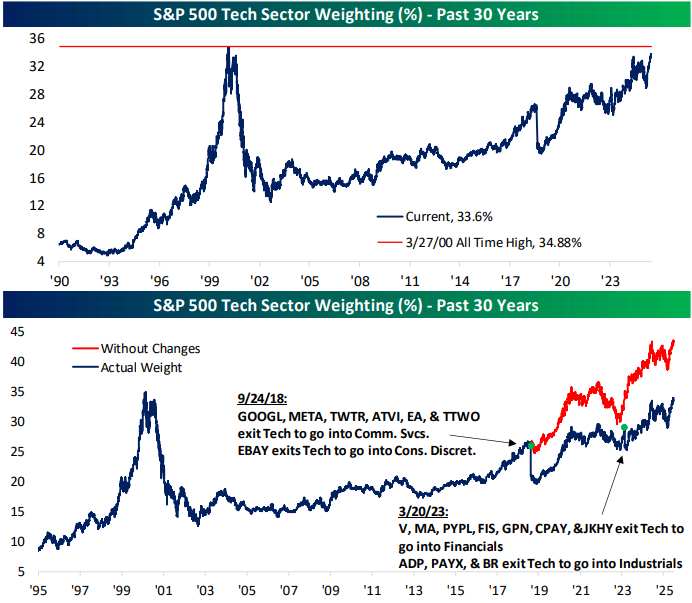
Amid the AI Boom, the Technology sector’s weighting in the S&P 500 has now eclipsed 1/3rd of the index. As shown in the first chart below, the only time the sector’s weighting has been higher was during a brief window in early 2000 at the peak of the Dot Com bubble.
But the first chart only tells part of the story. Back in 2018, those in charge of sector classifications reorganized many stocks in the S&P. Already-big stocks like Alphabet (GOOGL) and Meta (META) — Facebook at the time — were shifted out of the Technology sector and into the newly classified Communication Services sector. This resulted in a big drop in the Tech sector’s weighting in September 2018 that you can see quite clearly in the chart.
In the second chart below, we’ve included a red line that shows where the Technology sector’s weighting would be right now if the pre-2018 sector classifications were still in effect. Tech would have a weighting in the S&P 500 of roughly 43% right now rather than 33.6% if pre-2018 classifications were in place. 43%!
While its sky-high weighting could be a warning sign, Tech remains the driving force for the US stock market, while every other sector plays second fiddle.

Jul 28, 2025
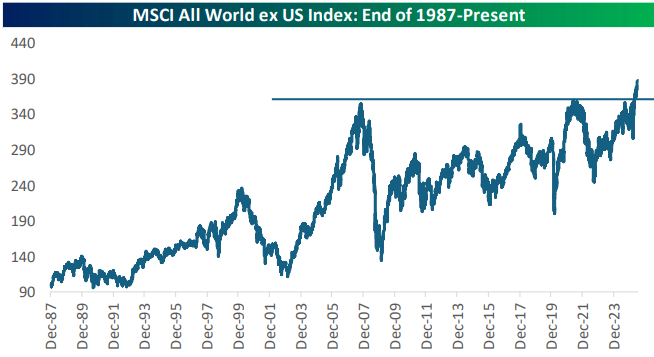
The plight of international equities for the last twenty years is well known to most investors, but in the last month or so, we’ve finally seen them break out to new all-time highs above two key resistance levels. Below is a chart of the MSCI All World ex US index, which basically tracks international equities as a whole. After a massive move higher in the first half of the 2000s, the Financial Crisis did a number on international stocks, and by the time COVID rolled around in early 2020, they had just barely gotten back to their pre-Financial Crisis highs. International equities recovered from the COVID Crash much more slowly than the US, and it has taken until this year for them to finally break out again. Are we now finally set for another big leg higher in international equities as the US works to make new trade deals with both friends and foes?
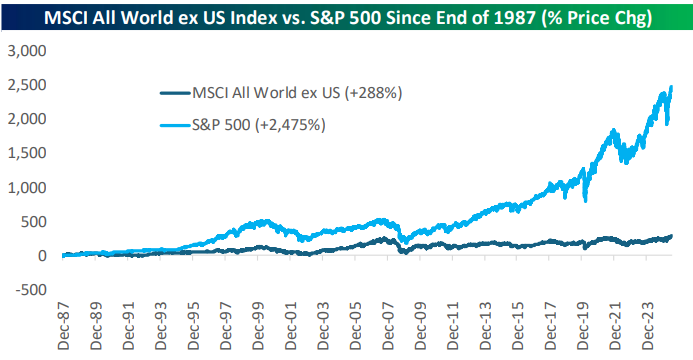
The massive underperformance of international equities versus the US can been seen in the chart below. Since the end of 1987, the US has beaten international equities by nearly 9x, with the S&P 500 gaining nearly 2,500% compared to a gain of 288% for the MSCI World ex US.
Jul 25, 2025
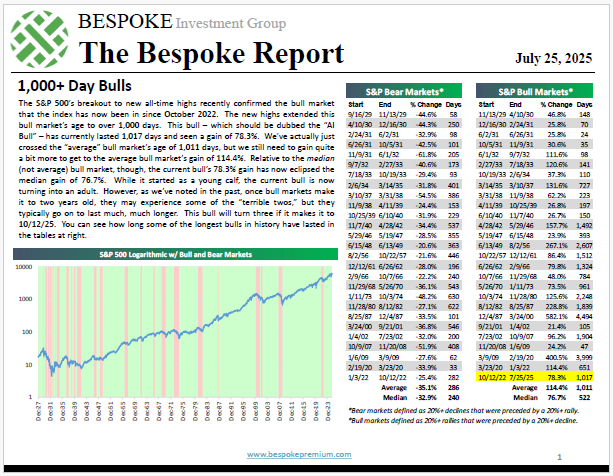
To read our weekly Bespoke Report newsletter and access everything else Bespoke’s research platform offers, start a two-week trial to Bespoke Premium. In this week’s report, we cover the bull market crossing the 1,000-day mark, underlying index technicals, how much the Fed should be cutting rates based on where inflation and employment stand, our unique Netscape vs. ChatGPT analysis, earnings season, longshot stocks, and more.