Bespoke’s Consumer Pulse Report – March 2026
Bespoke’s Consumer Pulse Report is an analysis of a huge consumer survey that we run each month. Our goal with this survey is to track trends across the economic and financial landscape in the US. Using the results from our proprietary monthly survey, we dissect and analyze all of the data and publish the Consumer Pulse Report, which we sell access to on a subscription basis. Sign up for a 30-day free trial to our Bespoke Consumer Pulse subscription service. With a trial, you’ll get coverage of consumer electronics, social media, streaming media, retail, autos, and much more. The report also has numerous proprietary US economic data points that are extremely timely and useful for investors.
We’ve just released our most recent monthly report to Pulse subscribers, and it’s definitely worth the read if you’re curious about the health of the consumer in the current market environment. Start a 30-day free trial for a full breakdown of all of our proprietary Pulse economic indicators.

The Bespoke Report – Iran War
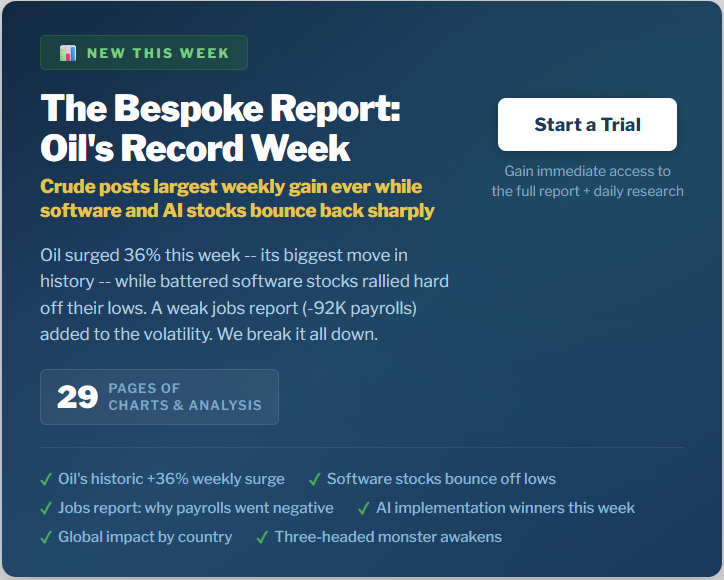
This Week’s Bespoke Report: Oil’s Record Week, Software’s Comeback, and the Iran Fallout
It was one of the wildest weeks in recent market history. Here’s a look at what we’re covering in this week’s Bespoke Report.
Oil Just Had Its Biggest Week Ever
Crude oil surged 36% this week, the largest weekly gain since at least 1985, after US/Israeli strikes on Iran effectively shut down tanker traffic through the Strait of Hormuz. By Friday afternoon, oil was trading above $91/barrel at its most overbought level in history. In the report, we look at what has historically happened to both oil and equities after spikes like this, and how quickly the pain is likely to show up at the gas pump.
Software Bounces Back
After falling more than 22% in the first two months of 2026, the iShares Expanded Tech-Software ETF (IGV) has rallied nearly 14% in just nine trading days with remarkably steady intraday buying pressure. The Citrini essay that terrified the sector on 2/22 may have marked the clearing-out event. It’s always easier to see in hindsight, but underneath all the snow on 2/23, there was plenty of blood on the software streets. We chart the bounce and put the current streak in historical context.
A Historic Reversal in Positioning
The Iran conflict triggered what looks like a broad deleveraging across institutional portfolios. Everything that worked in January and February stopped working this week, and everything that didn’t work started working. International equities that had been trouncing the US for months got hit the hardest, while the most beaten-down US stocks rallied sharply. We break down the reversal by asset class, country, and individual stock, and we explain why the US held up better than the rest of the world.
The Three-Headed Monster Awakens
Oil, Treasury yields, and the dollar. Our “three-headed monster” indicator just surged to its highest combined level in nearly a year. Two weeks ago, the monster was still asleep. We show where current readings sit relative to 40 years of history and what it has meant for forward equity returns.
Payrolls Go Negative
Friday’s jobs report showed a loss of 92,000 nonfarm payrolls, badly missing the +55K estimate. But the headline number is misleading. A big chunk of the weakness came from a single line item that will almost certainly reverse. We walk through what’s really going on beneath the surface, including what the data says about AI’s impact on younger workers.
The S&P 500 Keeps Bouncing
The S&P 500 opened down 1% or more on three separate days this week and managed to claw back each time. That’s only happened 13 times in SPY’s history since 1993. We look at where those prior weeks fell on the chart and what happened next.
That’s just a recap of some of the topics covered in this week’s Bespoke Report, our flagship weekly newsletter. This week’s edition is 29 pages of charts, tables, and in-depth analysis. If you’d like to dive in further, you can start a Bespoke trial to read the full report and get access to all of our daily research.
Six-Month Short Interest Swings
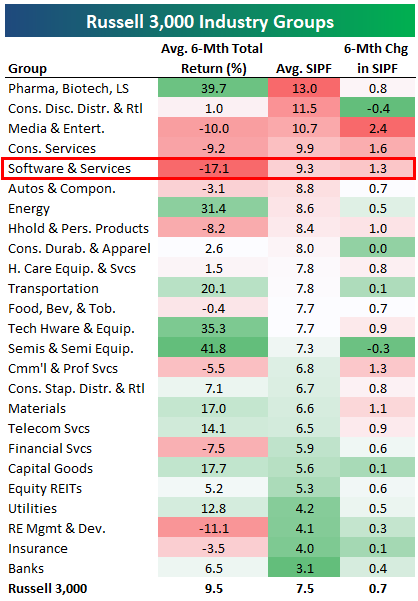
Below is an updated look at changes in short interest levels for Russell 3,000 stocks over the last six months. The average Russell 3,000 stock currently has 7.5% of its float sold short. That’s up 0.7 percentage points from six months ago at the end of August 2025.
The Pharma, Biotech & Life Sciences group has the highest average short interest as a percentage of float (SIPF) at 13%, followed by Consumer Discretionary Distribution & Retail (11.5%) and Media & Entertainment (10.7%).
The average stock in the Software & Services group is down 17.1% over the last six months, the worst of any group, and the average Software stock’s SIPF now sits at 9.3%. That’s up 1.3 percentage points from six months ago, which is elevated but not the most extreme jump across the 25 industry groups. Media & Entertainment has seen the biggest jump in SIPF at 2.4 percentage points.
Unsurprisingly, less volatile groups like Utilities, REITs, Insurance, and Banks have the lowest short interest levels.
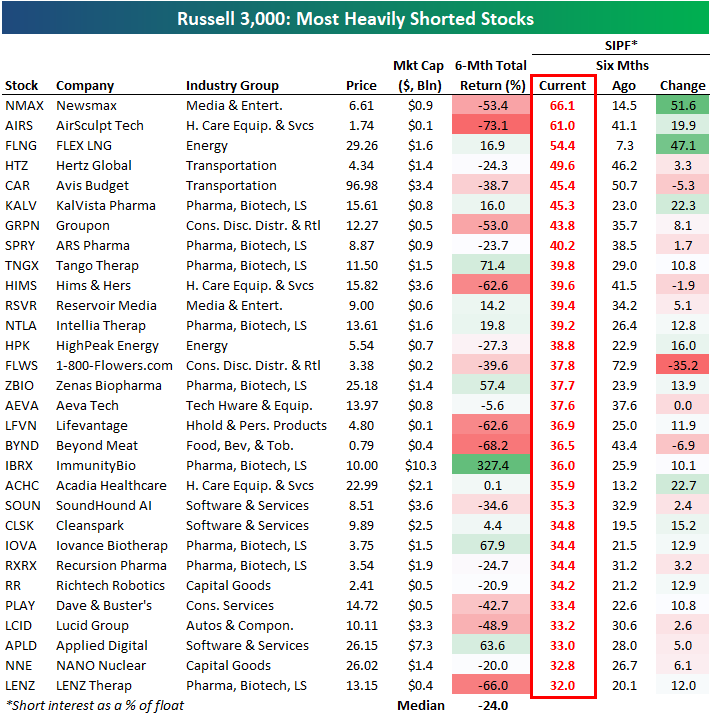
Below is a table highlighting the 30 stocks in the Russell 3,000 that currently have the highest short interest levels (as a percentage of float).
Conservative media outlet Newsmax (NMAX) is at the top of the list with nearly two-thirds of its float sold short, followed by AirSculpt Tech (AIRS) at 61% and FLEX LNG (FLNG) at 54.4%.
Most of the stocks on the list of heavily shorted names have market caps below $10 billion, but some of the names you may know include Groupon (GRPN), Hims & Hers (HIMS), Beyond Meat (BYND), SoundHound AI (SOUN), Dave & Buster’s (PLAY), and Lucid (LCID).
Both Hertz (HTZ) and Avis (CAR) are near the top of the list as well, while robotics company Richtech (RR) and small nuclear reactor company NANO Nuclear (NNE) also make appearances.
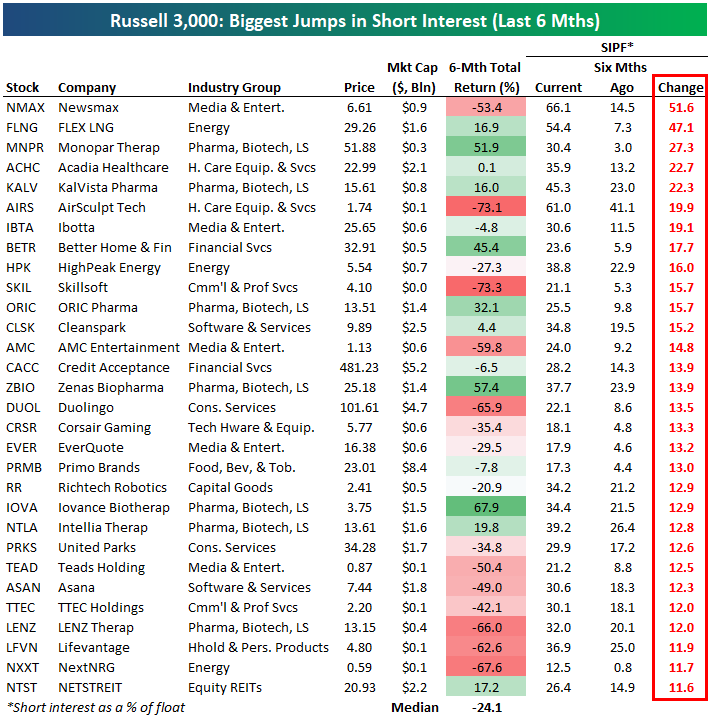
Below is a list of the 30 Russell 3,000 stocks that have seen the biggest increase in short interest over the last six months. Newsmax (NMAX) tops the list with SIPF jumping from 14.5% to 66.1%, followed by FLNG, MNPR, ACHC, and KALV. Other notables on the list include AMC Entertainment (AMC), Credit Acceptance (CACC), Duolingo (DUOL), Primo Brands (PRMB), and Asana (ASAN).
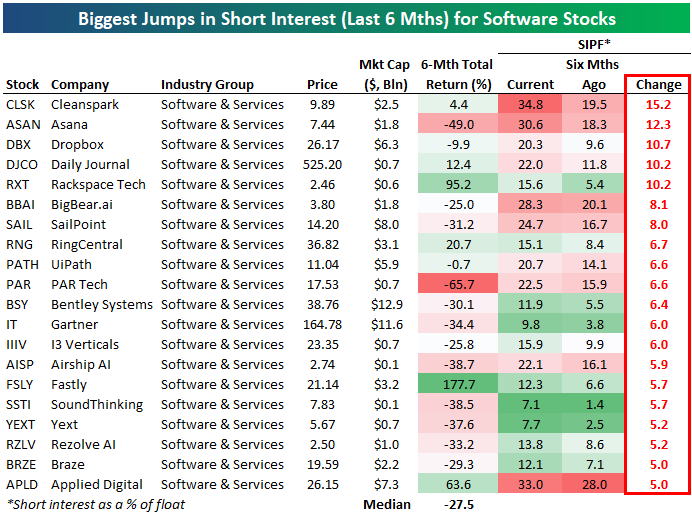
Looking just at software stocks, below are the stocks in the group that have seen the biggest jumps in short interest over the last six months.
Cleanspark (CLSK), Asana (ASAN), Dropbox (DBX), Daily Journal (DJCO), and Rackspace (RXT) top this list. Other names include SailPoint (SAIL), RingCentral (RNG), Bentley Systems (BSY), and Gartner (IT).
Like this analysis? Join our premium members by starting a trial today! Click below for details on how to sign up:

Country ETFs Hit Again Pre-Market
Last night we highlighted the big drop in global equity ETFs to start the week after the US/Israel attack on Iran caused energy prices to spike.
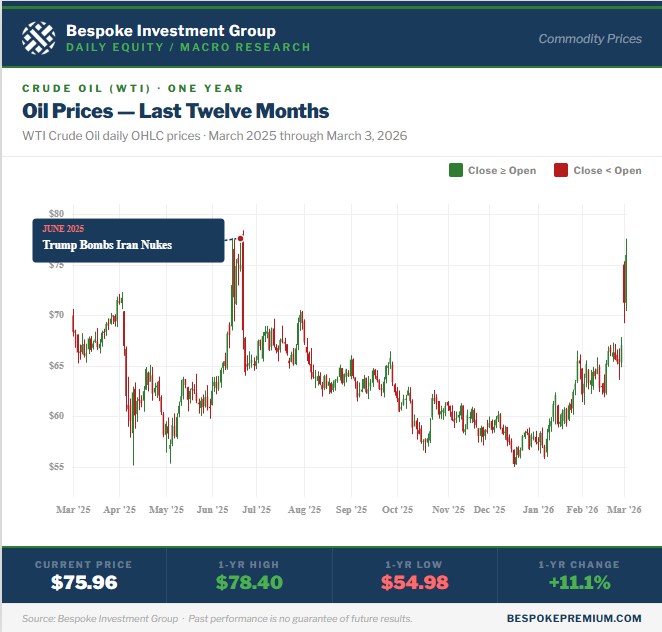
This morning, energy prices are trading sharply higher once again as investors begin to fear a more prolonged conflict in the Middle East. While oil traded up to $75/barrel yesterday, it finished the day just below $72. This morning, crude has gotten as high as $77.50, and it’s currently trading right around $76.
Notably, oil prices are currently right near the levels they peaked at last June when the US and Israel attacked Iran’s nuclear facilities.
Stock markets around the world are trading sharply lower once again today.
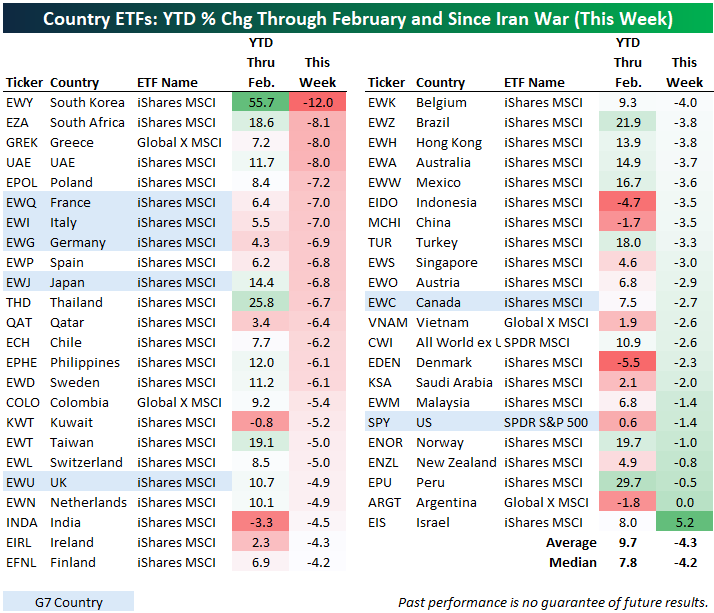
Below is a snapshot of 45 country ETFs traded on US exchanges, along with the all-world ex-US ETF (CWI). On average, these ETFs were up 9.7% year-to-date through February, but based on where they’re trading in the pre-market, they’re down an average of 4.3% already this week since the weekend attack on Iran.
The four hardest hit country ETFs have been South Korea (EWY), South Africa (EZA), Greece (GREK), and the UAE (UAE). All four of these are down 8% or more this week, with South Korea (EWY) down the most at 12%.
Israel (EIS) is the only country ETF that is up since the Iran attack with a gain of 5.2%, while the US (SPY) is down just 1.4%, the sixth best performer. Other country ETFs that have yet to get hit hard include Argentina (ARGT), Peru (EPU), New Zealand (ENZL), Norway (ENOR), and Malaysia (EWM).
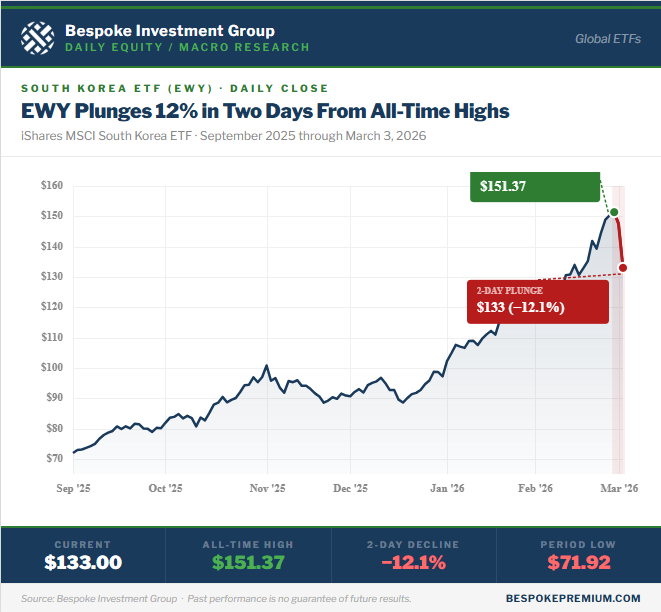
Below is a six-month price chart of the South Korea ETF (EWY), which was easily the best performer of the group recently through the end of February. Its 2-day drop of 12.1% only brings it back to levels it was trading at a couple of weeks ago.
Like this analysis? Join our premium members by starting a trial today! Click below for details on how to sign up: