Dec 8, 2022
The “Bespoke 50” is a basket of noteworthy growth stocks in the Russell 3,000. To make the list, a stock must have strong earnings growth prospects along with an attractive price chart based on Bespoke’s analysis. The Bespoke 50 is updated weekly on Thursday unless otherwise noted. There were twelve changes to the list this week.
The Bespoke 50 is available with a Bespoke Premium subscription or a Bespoke Institutional subscription. You can learn more about our subscription offerings at our Membership Options page, or simply start a two-week trial at our sign-up page.

The Bespoke 50 performance chart shown does not represent actual investment results. The Bespoke 50 is updated weekly on Thursday. Performance is based on equally weighting each of the 50 stocks (2% each) and is calculated using each stock’s opening price as of Friday morning each week. Entry prices and exit prices used for stocks that are added or removed from the Bespoke 50 are based on Friday’s opening price. Any potential commissions, brokerage fees, or dividends are not included in the Bespoke 50 performance calculation, but the performance shown is net of a hypothetical annual advisory fee of 0.85%. Performance tracking for the Bespoke 50 and the Russell 3,000 total return index begins on March 5th, 2012 when the Bespoke 50 was first published. Past performance is not a guarantee of future results. The Bespoke 50 is meant to be an idea generator for investors and not a recommendation to buy or sell any specific securities. It is not personalized advice because it in no way takes into account an investor’s individual needs. As always, investors should conduct their own research when buying or selling individual securities. Click here to read our full disclosure on hypothetical performance tracking. Bespoke representatives or wealth management clients may have positions in securities discussed or mentioned in its published content.
Dec 8, 2022
Sentiment tipped over before the S&P 500’s rough start to December. Without the market giving investors any more reason to take a bullish stance, the latest sentiment data from the AAII showed that once again less than a quarter of respondents reported as bullish. This week’s reading was actually slightly higher rising 0.2 percentage points to 24.7%, a reading in the middle of this year’s range.
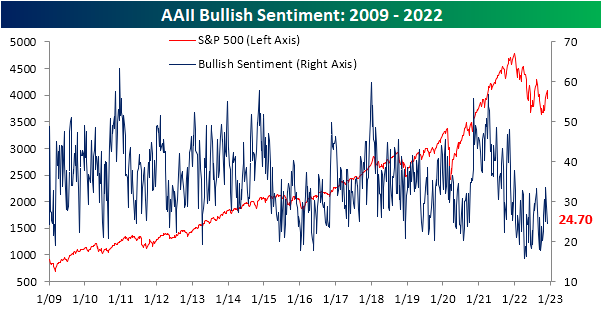
Although bullish sentiment was higher, bearish sentiment rose by more with the reading going from 40.4% to 41.8%. That is the highest level since November 10th. While bearish sentiment has remained in a relatively tight range just above 40% for the past four weeks, current readings are more muted than what had been observed throughout most of the past year when there have been plenty of readings above 50%.

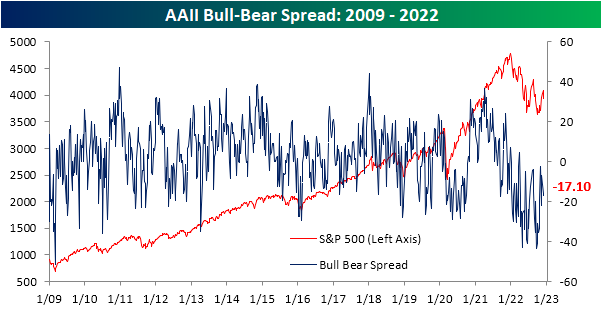
Overall, sentiment continues to heavily favor bears with a 17.1 percentage point spread between bulls and bears. That extends the record streak of negative readings to 36 weeks.
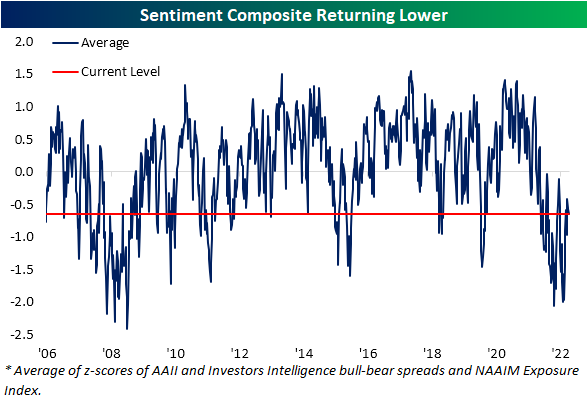
While the AAII survey was overall little changed, other sentiment readings were a bit mixed. The NAAIM Exposure index dropped to the lowest reading in a month. Conversely, the Investors Intelligence survey saw bulls surge to the highest level since late August combined with the lowest reading in the percentage of respondents expecting a correction since June. Aggregating all of these readings points to sentiment taking a bit more pessimistic of a stance this week than what has been observed over the past month. Click here to learn more about Bespoke’s premium stock market research service.
Dec 8, 2022
At first glance, recent data on jobless claims have not painted a pretty picture of the labor market. For seasonally adjusted initial claims, things have not soured too dramatically although recent readings remain well off the lows from earlier this year. In the latest week’s data, claims rose another 4K to 230K compared to last week’s upward revision of 226K. Given the moves in claims have been somewhat choppy over the past couple of months, the four week moving average has also risen to 230K, the highest reading since the first week of September. In other words, claims are still below summer highs but modestly trending back up to those levels.

On a non-seasonally adjusted basis, the move in the latest week’s reading is right in line with what could have been expected given seasonality. Jobless claims have historically risen over 80% of the time for the current week of the year with an average increase of 85K week over week. The 87K increase this week was right in line with that average and brings the indicator up to similar levels as the comparable weeks of 2017 through 2021 (excluding 2020).

Continuing claims have been the much more worrisome side of jobless claims recently. The seasonally adjusted reading has rocketed higher over the past several weeks, rising to a new high of 1.671 million this week. That is the most elevated reading since the first week of February. Whereas continuing claims had spent a long time below the pre-pandemic range, this latest reading is right back into that range. As we have noted in the past couple of weeks as well (see here and here), the rapid uptick in seasonally-adjusted claims has been consistent with the rise in claims during past recessions, meaning that even if claims are well below where they have been in the past, the speed and direction they have headed are worth keeping an eye on.

While continuing claims are flashing recessionary warning signs after seasonal adjustment, with the latest week’s data (the last week of November) covering a holiday, there are always some difficulties with the seasonal adjustment. On a non-seasonally adjusted basis, claims are still lower than comparable weeks of the year over the past 20 years (top chart below) as claims experience their typical swing higher for this point of the year. As shown in the second chart below, the current week of the year has historically experienced a large uptick. In fact, the average w/w increase for the current week has been 328K, roughly in line with the 300.9K rise in the latest data. Similarly, the total increase off the early October low (+363.5K) has likewise been smaller than the historical median of 538K.

In spite of the tendency of the large swing higher week over week historically, seasonal factoring was not quite as pronounced. As shown below, the seasonal factor was much weaker for the latest week’s data than say the prior few weeks. That is not to say the seasonal adjustment is necessarily wrong or worries of recession as a result of recent moves in the adjusted number are not without merit, rather it is worth noting that the seasonally adjusted number could be sending the message of a more elevated reading on claims than in actuality. In other words, it is not perfectly clear how much of the increase in continuing claims has been the result of seasonality or the beginnings of recession. Click here to learn more about Bespoke’s premium stock market research service.
