Apr 28, 2017
Today’s advance read on Q1 GDP came in weaker than expected this morning, missing forecasts by 0.3 percentage points. While economists were forecasting a SAAR reading of 1.0%, the actual reading came in at 0.7%. The fact that this report was weaker than expected should come as a surprise to no one. The table below was pulled from our Interactive Economic Indicator Database (available to all Institutional clients) and shows the originally reported advance read on Q1 GDP versus estimates dating back to 1999. In the last 19 years, this report has only been better than expected four times. In the last fifteen years, it has only been better than expected once, and in the last nine years, it has been weaker than expected every year! This trend gives new meaning to the phrase, “If at first you don’t succeed, try, try, try, try, try, try, try, try, and try again!” When it comes to forecasting errors, Q1 GDP has been the Mother of all Seasonal Distortions (MOASD).

Apr 27, 2017
Log-in here if you’re a member with access to the Closer.
Looking for deeper insight on global markets and economics? In tonight’s Closer sent to Bespoke Institutional clients, we take a look at the strong rebound in investment in Q1 GDP stats due tomorrow morning. We also recap the durable goods report from today, quarterly US Census stats on the US housing stock, and a couple data points from Mexico and Brazil.

The Closer is one of our most popular reports, and you can sign up for a free trial below to see it!
The Closer is one of our most popular reports, and you can see it and everything else Bespoke publishes by starting a no-obligation 14-day free trial to our research!
Apr 27, 2017
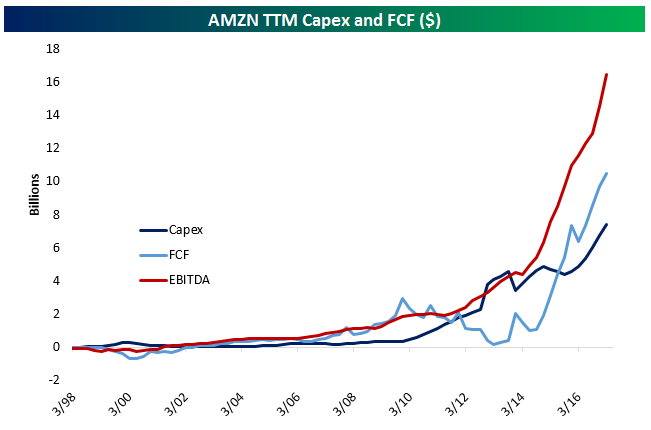
Amazon (AMZN) blew earnings out of the water tonight, with GAAP earnings per share coming in at $1.48 versus $1.08 expected. But all you really need to understand just how fast Amazon is creating value is the chart below. It shows three metrics, all trailing 12 month averages going back to 1998. The red line is earnings before interest, taxes, depreciation, and amortization. It’s how much Jeff Bezos and company earn before they pay interest on debt, the tax man, and cover the cost of depreciation on assets they own. It’s accelerated in a breathtaking move from less than $3 billion five years ago to more than $16 billion today. Amazon has also been pouring money into build-outs of its network of distribution centers, Amazon Web Services infrastructure, and a variety of other projects which has sent its capital expenditure surging from less than $2 billion five years ago to over almost $7.5 billion over the last 12 months. Initially, that reduced free cash flow. But EBITDA is growing so quickly, Amazon can no longer invest fast enough to soak it all up! The results? An explosion of cash that totals $10.5 billion over the last year. Relative to the company’s $440 billion market cap, that’s not huge…but it’s growing at an absurd rate, and investors think the Seattle-based company can sustain that pace. Shares are up almost 4% in the wake of results.
Apr 27, 2017
We’ve just released our weekly Sector Snapshot report (see a sample here) for Bespoke Premium and Bespoke Institutional members. Please log-in here to view the report if you’re already a member. If you’re not yet a subscriber and would like to see the report, please start a 14-day trial to Bespoke Premium now.
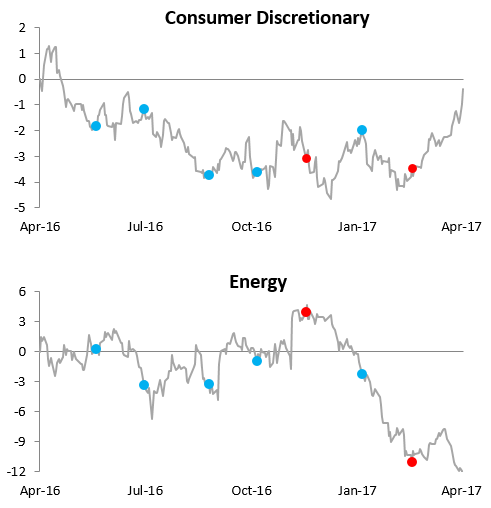
Below is one of the many charts included in this week’s Sector Snapshot, which highlights the relative strength versus the S&P 500 over the last year for the Consumer Discretionary and Energy sectors. When the line is rising, the sector is outperforming the S&P 500. When the line is falling, the sector is underperforming. As you can see, the relative strength for Consumer Discretionary has sky-rocketed over the last few weeks just as the Energy sector has fallen. There’s a clear shift going on in these two sectors.
To see our full Sector Snapshot with additional commentary plus six pages of charts that include analysis of valuations, breadth, technicals, and relative strength, start a 14-day free trial to our Bespoke Premium package now. Here’s a breakdown of the products you’ll receive.