Jul 14, 2022
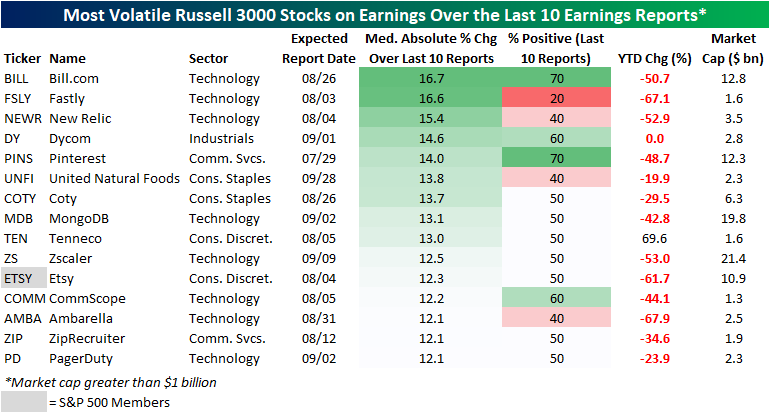
With earnings season kicking off, we wanted to highlight Russell 3000 stocks that in recent history have been the most volatile in reaction to earnings (over the last ten quarters). In order to be included in this list, a stock must have reported at least ten quarters since going public and must also have a market cap over $1 billion. The list includes tech companies, e-commerce players, food producers, and more. On average, these stocks are down 35.1% on a YTD basis (median: -44.1%), which is notably worse than the overall market. We measured volatility by the median absolute percent change on earnings reaction days over the last ten quarters, and these names averaged a move of 13.6% in either direction on their earnings reaction days. The most volatile name has been Bill.com (BILL), followed by companies like Fastly (FSLY), New Relic (NEWR), Dycom (DY), and Pinterest (PINS). Only one of the stocks outlined below is in the S&P 500 (Etsy), and none have a market cap of more than $21.4 billion.
Of course, volatility does not imply direction. Of the 15 stocks outlined below, two – BILL and PINS – have seen seven of their last ten reports result in gains on their earnings reaction day. On the other end of the spectrum, four stocks have seen positivity rates of 40% or less over the last ten reports: Fastly (FSLY), New Relic (NEWR), United Natural Foods (UNFI), and Ambarella (AMBA). If you own any of these names, be prepared for a potentially sharp reaction to earnings (in either direction) when they report this earnings season. Click here to learn more about Bespoke’s premium stock market research service.
Just to show you what we mean, the graphic below shows BILL’s (the most volatile name on the above list) earnings reactions over the last 10 quarters. As you can see, eight of its last ten reports have been followed by a one-day reaction of 10%+, including four moves of more than 20%! Click here to learn more about Bespoke’s premium stock market research service.

Apr 7, 2022
“You pay a very high price for a cheery consensus. It won’t be the economy that will do in investors; it will be the investors themselves. Uncertainty is actually the friend of the buyer of long-term values.” Warren Buffett
You don’t need us to tell you that 2022 has been a volatile year for the stock market, but in one way it has been even more volatile than you think. Nowhere in the equity market has the uncertainty and day-to-day moves been higher than in the Nasdaq. Over the last 50 trading days, the Nasdaq’s average daily move has been a gain or loss of 1.76%, and on a YTD basis, the average remains at a still unsettling level of 1.66%. To put this in perspective, in all of 2021, there were only 37 days that even experienced a gain or loss of 1.66% or more. While volatility has spiked this year, relative to other periods in the last thirty years or so, there have been plenty of other stretches when the average daily move spiked even more. Back in early 2020, the Nasdaq’s average daily move over the prior 50 trading days spiked to more than 3%, and in October 2011, the average daily move spiked to just over 2%. Those two periods, however, pale in comparison to the Financial Crisis when the average daily move approached 4% per day! That was even greater than the highs from the bursting of the dot-com bubble when 3% daily moves for the Nasdaq were routine.

Although the Nasdaq’s average daily move is nowhere near its highest levels of the last twenty years, volatility has still been extremely high. While this week is only three trading days old, we’ve already had three days where the Nasdaq had a daily move of at least 1%, and as a result, we have now had a total of 12 straight weeks where the Nasdaq experienced at least three 1% daily moves (even including holiday-shortened weeks). In the chart below, we show weekly streaks where the Nasdaq experienced at least three trading days of 1% moves. The current streak isn’t over, but it has already eclipsed any streaks seen during the COVID crash or the Financial Crisis. In fact, to find a longer streak you have to go all the way back to September 2002 in the waning days of the dot-com crash.
As noted above, Warren Buffett once said that uncertainty is the friend of the buyer of long-term values, but volatility can be unsettling for individual investors, and as Peter Lynch once said, “Not everyone has the stomach. If you are susceptible to selling everything in a panic, you ought to avoid stocks and mutual funds altogether.” Click here to view Bespoke’s premium membership options.

Mar 25, 2022
The CBOE Volatility Index (VIX) was invented to allow investors to speculate about volatility over the next 30 days. The VIX is commonly referred to as the fear index, and readings above 20 tend to occur in uncertain times filled with concern, while readings below 20 indicate a perceived relatively low-risk environment. As of late, the average intraday range of the S&P 500 has been quite high, with the last 30 trading days averaging a trading range of 2%, which is on the high side relative to history. In fact, the 30-day rolling average percentage spread between intraday highs and lows did not cross 2% throughout the entirety of 2021, but on the first day of February 2022, we broke a 440 trading day streak in which the reading was below 2% that had bene in place since the days coming out of the COVID crash.

As depicted below, the VIX tends to spike during times in which market volatility increases. However, the current elevated level of intraday volatility has not been matched with a proportional rise in the VIX. Based on historical data, the VIX should currently be closer to 26.5, but the current reading of 21.8 is 17.6% below the implied value we would derive from the last 30 days of intraday volatility alone. This suggests that although the market has been shaky as of late, investors expect an easing of that volatility in the near future. Click here to view Bespoke’s premium membership options.
