Apr 28, 2022
Yesterday, Meta Platforms (FB) reported earnings. In the report, the company noted a sequential rise in both daily and monthly active users in every region apart from Europe, which can be attributed to the effects of the war in Ukraine. This gave investors a sigh of relief, sending shares up over 14% in premarket trading.
FB has gapped higher by 5%+ in reaction to earnings fourteen times since its IPO. Historically, when this occurs, the stock’s performance from the open and close has been modestly positive, booking gains 57% of the time. The average performance was a gain of 64 basis points (median: 80 bps). The worst intraday performance came in 2014 when the stock traded down by 2.0% percentage points intraday after gapping up 16.05%. On the other hand, the best intraday performance in these time periods occurred in 2018, when the stock gained 4.5% after gapping up 6.0% at the open.
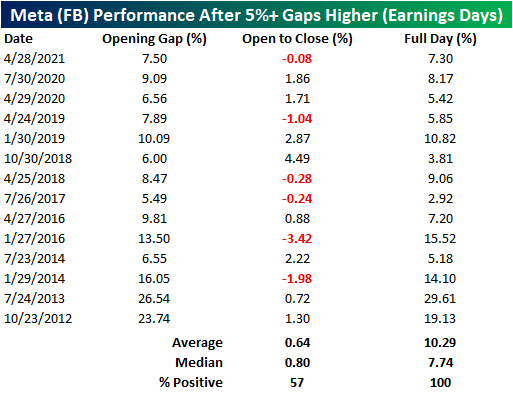
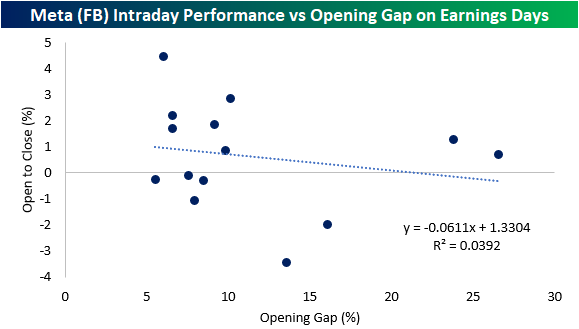
Today marks the fourth-best opening gap since FB went public. This is particularly interesting, as the y/y revenue growth rate in this quarter was the slowest seen since the company went public in 2012. Notably, the opening gap does not seem to be a determining factor for the opening to close performance. As you can see from the chart below, only 3.9% of the variation in the open to close performance can be explained by the size of the opening gap (for 5%+ opening gap gains on earnings). Click here to view Bespoke’s premium membership options.
Apr 26, 2022
The Richmond Fed’s manufacturing survey was released this morning showing a modest improvement in conditions in the month of April. The headline number rose by a point to 14 which is still in the middle of the pandemic range of readings and the highest level since December.

In spite of the improvement in the composite index—a weighted average of shipments, new orders, and employment—the breadth of this month’s report was negative with over half of the categories declining month over month. Two of those declining categories were new orders and employment which are again inputs for the composite. That means the higher reading of the composite was entirely thanks to the 8-point increase in shipments.
Looking across other areas of the report, expenditures were weaker while inventories are recovering from historic lows. While business conditions are mixed to deteriorating, supply chains are showing signs of improvement as evidenced by the increase in shipments.
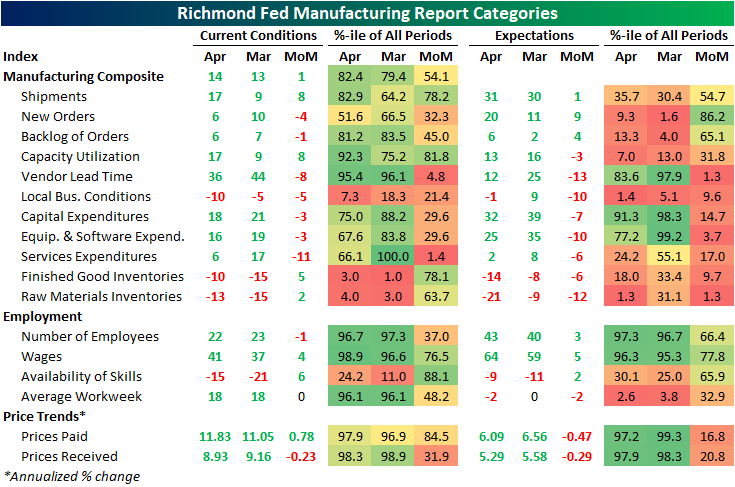
While shipments were an area of strength, another input to the composite, new orders, fell 4 points and is back near the middle of its historical range. Expectations, however, experienced a sizeable rebound with that index rising 9 points. While that increase bucks the trend of weak expectations readings relative to current conditions that we have seen in other regional Fed surveys (which we discussed in last night’s Closer), this index’s increase was the exception rather than the rule. As shown in the table above, only a handful of other expectations categories rose month over month with many declines ranking in the bottom decile of monthly moves.
The big increase to shipments left that index at the highest level since last July as backlog of orders are growing at a substantially more modest pace compared to earlier in the pandemic. One likely reason that both of these readings are improving is a coincident improvement in supply chain stress. The index for lead times saw an 8-point decline ranking in the bottom 5% of all monthly moves. That leaves the index one point above the December low of 35.

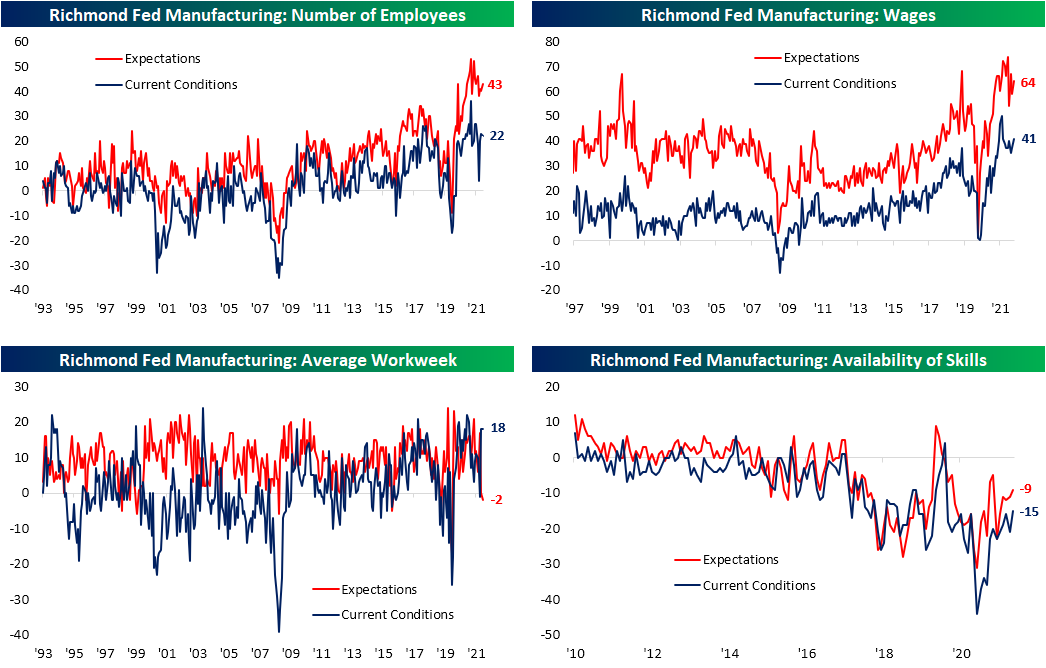
Employment metrics were mixed this month. The region’s firms are still hiring on a net basis, but hiring has peaked and declined again in April. That was in spite of firms also reporting better availability of workers with in-demand skills as that index rose to the highest level since July 2020. With that being said, the negative number indicates a still insufficient supply of quality talent. Wages, meanwhile, saw one of the larger increases in recent months rising to the highest level since September. The average workweek was unchanged at a healthy level in the top 5% of its historical range, but expectations are calling for declines in hours worked on the horizon. Click here to learn more about Bespoke’s premium stock market research service.
Apr 25, 2022
As shown in the snapshot of our Earnings Explorer below, the next two weeks will be the busiest parts of earnings season before things quiet down headed into May. While there will be many more from names not in the index, by next Friday, there will be a total of 917 S&P 1500 companies reporting results with next Thursday the single busiest single day as 184 companies report.

It’s not only a busy week of earnings in terms of the number of companies reporting, but also the size of those companies. In today’s Chart of the Day, we highlighted how this week will see some of the largest companies in the world releasing results all in the same week for just the eighth time on record. As shown below, even though next week will have a higher number of companies reporting, the combined market caps of the companies releasing quarterly results this week far outsize next week. Of course, that is largely thanks to mega-caps. For example, tomorrow there will be over $4 trillion in market cap reporting between three names alone: Visa (V), Alphabet (GOOG), and Microsoft (MSFT). Wednesday will see the half-trillion dollar Meta Platforms (FB) report followed by the biggest day of earnings by market cap on Thursday, totaling nearly $8 trillion. Again, two names alone are a huge share: Amazon (AMZN) and Apple (AAPL). Click here to view Bespoke’s premium membership options.

Apr 25, 2022
It was another weaker than expected regional manufacturing report this morning as the Dallas Fed’s survey came in at 1.8. The index was expected to decline, but to a more modest reading of 3.5 from last month’s level of 8.7. With expectations declining hand in hand, this report indicates southern manufacturers have seen a significant deceleration in growth and also expect that to continue in the future as the indices for current and future conditions are around the weakest of the pandemic.

Current condition indices out of Dallas more closely resembled the results of the Philly Fed survey last week with weak breadth and readings falling into the middle of their historical ranges. However, like both the Philly and Empire Fed readings, expectations are deteriorating much more quickly than current conditions. As shown below, while many current condition indices are at worst in the middle of their historic ranges, some expectations indices have fallen into the bottom decile of readings after historically large declines month over month in April. For example, the decline in expectations for New Orders ranks in the bottom 1% of all month-over-month moves.
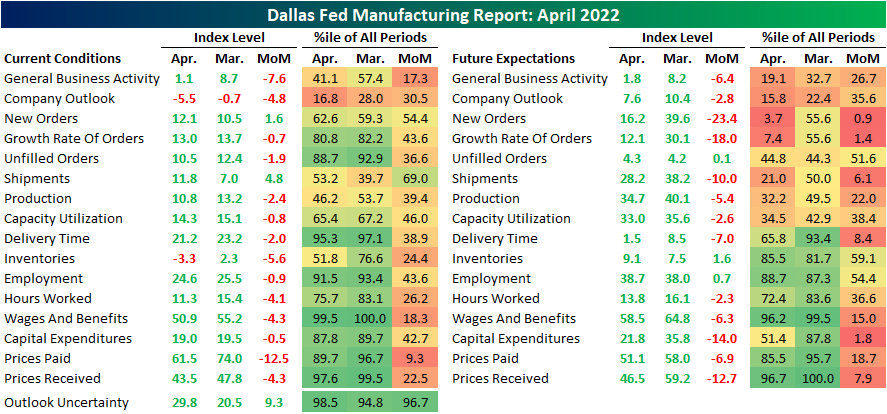
Two indices for current conditions were in contraction in April. The first was inventories while the other, and more negative, was company outlook. This index is now at its lowest level since the historic lows set in the spring of 2020. While still positive, the same can be said for expectations as they have breached new lows as well. That means on net more reporting firms are seeing economic conditions deteriorating than improving.

At the moment, demand has held up with the index for New Orders ticking up slightly though it is well below levels set earlier in the pandemic. As such, Unfilled Orders are still growing but at a slower rate as Shipments saw a modest increase off of post-pandemic lows. Again, in spite of any improvements reported in current conditions, Texas manufacturers do not expect much good to come on the horizon. The monthly declines in expectations for New Orders and New Order Growth Rate rank in the bottom 1% and 2%, respectively, of all monthly changes. While it was not as large of a drop, shipments similarly experienced a sharp decline ranking in the bottom few percentiles.

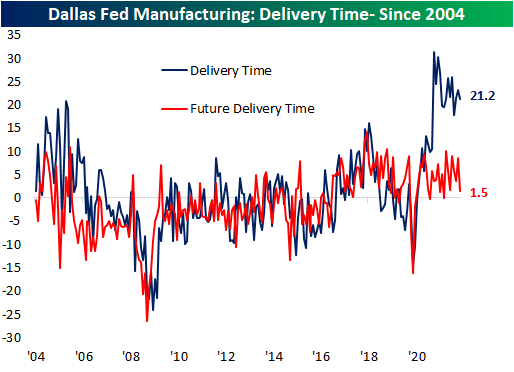
As for one silver lining of the report, there was further evidence of easing of supply chain stress with the Delivery Time index falling to 21.2. This index has been consistently falling over the past year. Expectations saw a coincident decline.
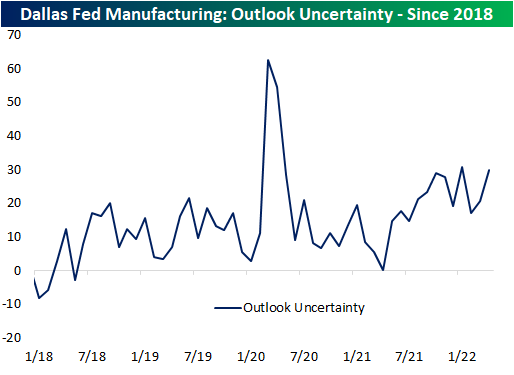
The Dallas Fed also includes in the report an index on uncertainty; a newer index only dating back to 2018 tracking the change versus the prior month in the firm’s uncertainty about company outlook. This index has returned to the upper end of its range near 30. That is slightly below the January reading for the highest levels in the series’ history outside of the beginning of the pandemic.
Be sure to check out tonight’s Closer which will provide an update of our Five Fed Manufacturing Composite, which combines these Dallas Fed readings with those of the Empire and Philly Fed surveys to gauge overall national manufacturer activity. Click here to view Bespoke’s premium membership options.
Apr 22, 2022
This week’s Bespoke Report newsletter is now available for members.
Early Thursday morning, investors were feeling pretty good about the trading week. At that point, the S&P 500 was up 1% on the day and about 2.7% week-to-date, and the index had actually just pushed back above its 200-day moving average.
There was nothing we could identify in the news that caused the S&P to peak around 10 AM ET, but from that point through the closing bell on Friday, the index fell 5.3% in basically as straight of a line lower that you can draw.

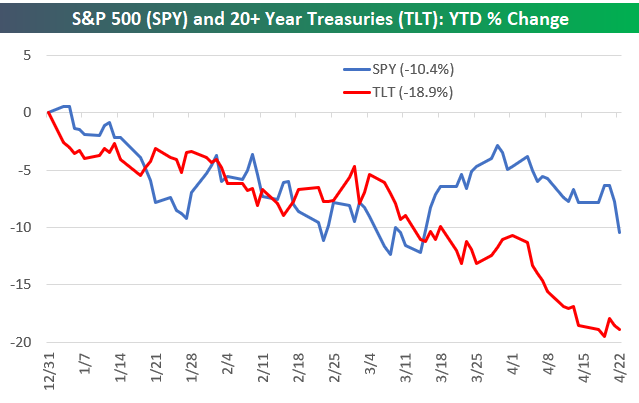
Fed Chair Powell did, however, make comments in a speech at the IMF mid-day Thursday where he confirmed that a 50 basis point hike was “on the table” for the May meeting. Markets have been pricing high odds for 50 bps hikes for some time now, but Powell’s comments basically cemented them (for now).
The Powell Fed is known for its jawboning and transparency when it comes to the path for rates. The chart below of equities and fixed income in 2022 tells you what these two asset classes currently think of that jawboning:
The snippet above is pulled from a page from this week’s Bespoke Report newsletter. If you’re not a Bespoke subscriber and you want to read this week’s full Bespoke Report (and access everything else Bespoke’s research platform has to offer), start a two-week trial to one of our three membership levels.

