May 10, 2022
As we noted in an earlier post, inflation appears to be a major driver as to why small businesses are reporting historic pessimism for the US economy. Looking across the most important problems reported by small businesses in the NFIB’s monthly survey, inflation takes the cake as the biggest concern. Nearly a third of responding firms reported higher prices as their biggest problem; the highest level on record in data going back to 1986. That has now surpassed the prior series high of 20% in mid-2008.
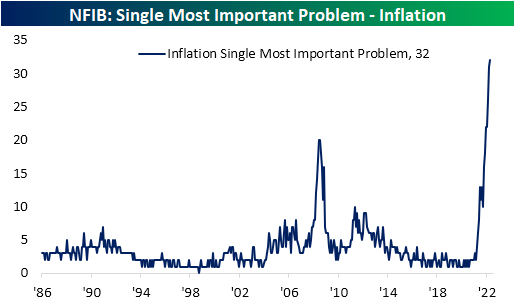
Given inflation has stolen such a large share of small business worries, several other problems are now at or near record lows. For example, no firms reported competition from big businesses as the biggest issue. Government requirements and red tape are similarly at a record low after a one percentage point decline month over month. Taxes, poor sales, and financial and interest rates are also not a huge concern according to the survey.

With both government-related concerns dropping yet again, the combined reading between the percentage of respondents reporting taxes and government red tape as their biggest issues hit a new record low of 22%. The past few Presidential administrations have seen this reading more elevated and rising with Democrat presidents while Republican Presidents have coincided with lower readings. The current administration is now an exception with big declines as inflation concerns have come front and center.

The rise of inflation concerns have also resulted in a pullback in the share of respondents reporting cost or quality of labor as the biggest issue. While the combined reading rose one point in April thanks to the quality of labor, the combined reading is well off the peak of 40% from last September. Additionally, for the second month in a row and for the first time in roughly a decade, inflation continues to be the bigger concern. Click here to learn more about Bespoke’s premium stock market research service.

May 10, 2022
In 2020 and most of 2021, dividend stocks underperformed the broader S&P 500 as investors put an emphasis on growth due largely to the low-rate environment. Since the Fed pivot to a tightening bias beginning in late 2021, though, there has been a sharp reversal in this trend.
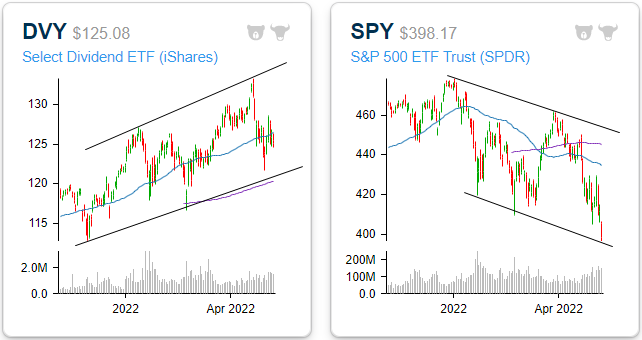
As it currently stands, the iShares Select Dividend ETF (DVY) has made up just about all of its pandemic-era underperformance versus the S&P 500 (SPY). Since the pre-pandemic highs, DVY has gained 16.9% versus a 17.9% advance for SPY, and that doesn’t even include the impact of dividends. After taking into account DVY’s higher yield (3.0 vs 1.6%), it is actually outperforming SPY during this span. Looking more closely at just 2021, DVY has outperformed SPY by 17.7 percentage points (+1.3% vs -16.3%) as investors have exited growth and into more value and income-oriented investments.

Whereas all of the major indices have entered downtrends, DVY is yet to break its uptrend. The ETF is trading well above its 200-DMA but slightly below the 50-DMA. Overall, the technical picture is relatively attractive, especially in comparison to the broader market. The following graphs are accessible through our Chart Scanner tool. Gain access to our proprietary tools by clicking here to view Bespoke’s premium membership options.
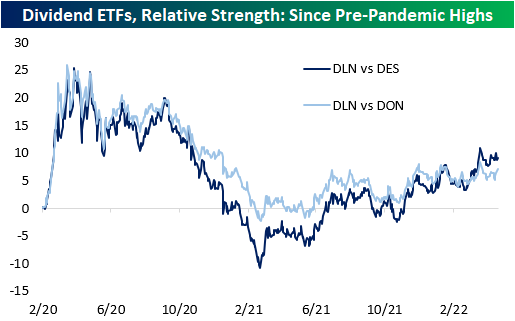
Within the high-dividend space, large caps have outperformed both mid and small caps. The WisdomTree US Large Cap Dividend ETF (DLN), the WisdomTree US Mid Cap Dividend ETF (DON), and the WisdomTree US Small Cap Dividend ETF (DES) were the funds used to compare performance across market caps. As you can see from the chart below, the larger companies that pay hefty dividends have outperformed mid-caps, and mid-caps have outperformed small caps. All three ETFs have similar yields, so the market cap discrepancies are likely more market-related.
While the average S&P 500 stock is down 11.8% on a year-to-date total return basis (median: -14.7%), the 25 highest dividend-paying stocks excluding energy (shown below) are down an average of 8.6% (median: -11.8%). Although this performance is not stellar, the average is still 320 basis points above that of the broader index. Given the recent surge in energy prices over the last year, a number of stocks in the Energy sector have seen their dividend payouts surge. Given the volatile nature of energy prices, the level of these yields may not be sustainable, so for that reason, we have left them out of this specific list.

May 10, 2022
See what’s driving market performance around the world in today’s Morning Lineup. Bespoke’s Morning Lineup is the best way to start your trading day. Read it now by starting a two-week trial to Bespoke Premium. CLICK HERE to learn more and start your trial.
“It always seems impossible until it’s done.” – Nelson Mandela

Below is a snippet of content from today’s Morning Lineup for Bespoke Premium members. Start a two-week trial to Bespoke Premium now to access the full report.
It’s been a painful three days for US equity investors, and they’re looking to catch a break today as S&P 500 futures are indicating a rally of about 1% at the open. Investors have been fooled enough times this year already by a strong tape at the open, so you can’t fault them for viewing this morning’s rally with a fair amount of skepticism.
Treasuries are also rallying this morning as the 10-year yield is back below 3%. The only economic news on the calendar this morning was the NFIB Small Business Optimism report which was unchanged from March and slightly ahead of expectations.
Over in Europe, economic sentiment came in better than expected whole Industrial Production in Italy managed to come in unchanged versus forecasts for a decline of 1.9%.
In today’s Morning Lineup, we recap the recent developments in stablecoins (pg 4), overnight earnings (pg 5), economic data out of Asia and Europe (pg 6), and a lot more.
After breaking below support to close last week, the bottom fell out of the Nasdaq 100 yesterday as the index dropped to another 52-week low and its lowest level since November 2020.

With the Nasdaq 100 at 52-week lows, we wanted to check in on its valuation and how it looks relative to the S&P 500. The chart below shows the historical premium in the Nasdaq 100’s P/E ratio relative to the S&P 500. For the last ten years, there has never been a point where the Nasdaq 100 traded at a cheaper valuation than the S&P 500, and the average premium during that span has been 23.1%.
Towards the end of 2019, right before COVID, the Nasdaq 100’s premium valuation to the S&P 500 was right in line with its historical average, but that premium exploded higher during COVID reaching as much as 50% in late 2021. Through a combination of earnings growth and rapidly falling stock prices, much of the air has come out of the Nasdaq 100’s premium relative to the S&P 500, but it still remains elevated relative to the historical average.

Start a two-week trial to Bespoke Premium to read today’s full Morning Lineup.
May 5, 2022
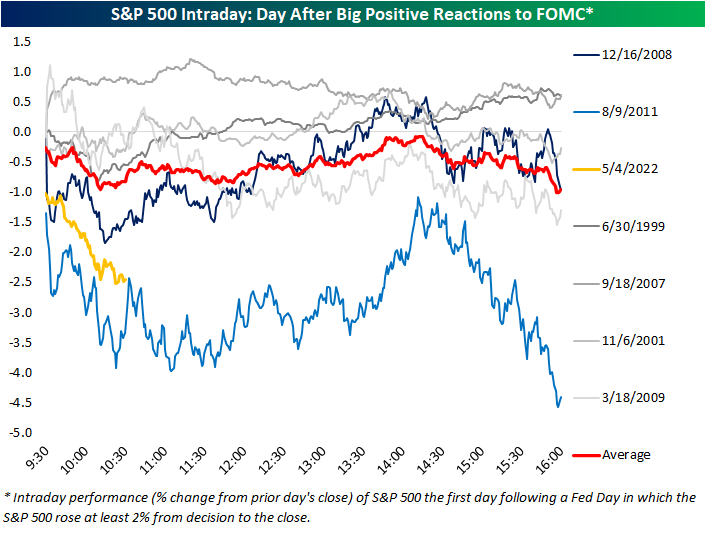
In last night’s Closer, we recapped the market reaction to the FOMC’s 50 bps rate hike noting that equities really took off once Fed Chair Powell ruled out the possibility of 75 bps hikes on the horizon. By the close, the S&P 500 rallied 2.55% from right before the decision (1:59 PM). As shown below, that marked the third-best S&P 500 reaction to a Fed day since 1994 when the FOMC began to announce its decision on the same day as the meeting.

Given today’s massive declines, the S&P has already erased its 2%+ post-FOMC gain. Below we show the S&P’s intraday performance the day after each Fed day when the index rallied over 2% post-meeting (1:59 to the close). For each day, the date shown represents the day of the FOMC meeting. On average, the S&P 500 has tended to gap down the following day and continue to trade lower throughout the first post-FOMC session as we are seeing today.
Today’s performance is certainly on the weaker end of these occurrences, though. In fact, like the other two largest post-FOMC rallies that saw over 3% gains in the afternoon of Fed days, December 2008 and August 2011, today saw a significant gap lower with continued losses through mid-morning. The continued selling today is setting up to more closely resemble the August 2011 occurrence. Following the December 2008 instance, on the other hand, the S&P 500 found a low in the late morning and even briefly went positive the day after the big post-FOMC gain.
While today is shaping up to look like another time the market rallied hard in response to the FOMC, taking a step back to look at all Fed day afternoon performance (1:59 to the close) versus next-day performance (full day), there is not much of a strong trend. As shown below, the S&P 500’s performance from 1:59 to the close on a Fed day is a statistically poor explainer of next-day performance. That being said, today does stand out as one of the worst Fed day follow-ups on record. Click here to learn more about Bespoke’s premium stock market research service.

May 5, 2022
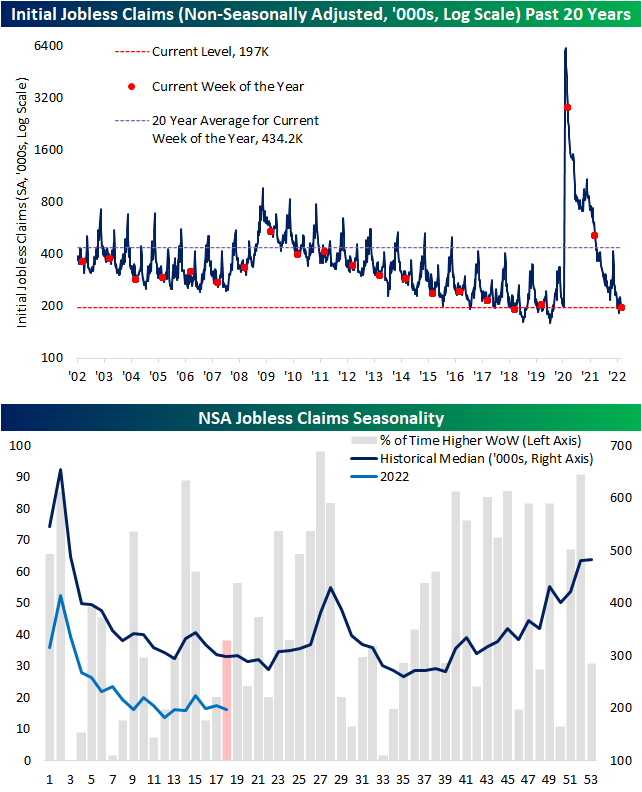
Initial jobless claims have come off of multi-decade lows in the past few weeks with the most recent print released this morning marking the most significant increase in some time. Claims are back up to 200K for the first time since the week of February 11th. Additionally, the 19K week over week increase was the largest one-week uptick since last July when they rose 33K and the level of claims was more than double what it is now.

Non-seasonally adjusted claims are also still at historically strong levels albeit having come off the lows. The only comparable week of the year that has seen a lower reading on claims was in 2018 when they were roughly 7K below current levels.
In terms of seasonal trends, claims will likely continue to fall modestly in the coming weeks before running into some seasonal headwinds in the late spring and early summer.
Continuing claims are delayed an additional week to initial jobless claims and this reading set a new low in the most recent print. Claims fell below 1.4 million for the first time since February 1970 reiterating the point that there are a historically small number of people filing continued unemployment claims. Click here to learn more about Bespoke’s premium stock market research service.
