May 13, 2022
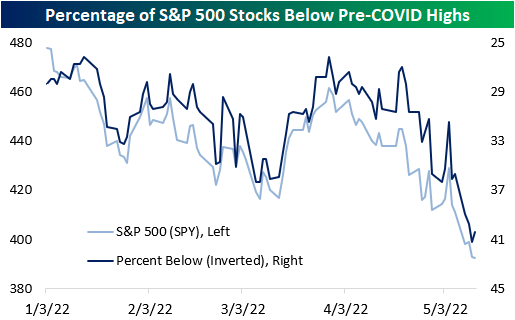
Two days ago, we outlined the percentage of stocks in each S&P 500 sector that were below their pre-COVID highs to show that many of the stocks that surged due to pandemic effects have significantly fallen off, netting long-term holders a negative return since the onslaught of the pandemic. Over the course of the next few weeks, we will be outlining the S&P 500 stocks that are breaking below/above their pre-COVID highs, as we did yesterday. Yesterday, the S&P 500 fell by 10 basis points to close at a new 52-week low, but the index is still up over 15% relative to pre-COVID highs. As of yesterday’s close, 40.4% of S&P 500 stocks were below this critical level, an 80 basis point improvement relative to the close on 5/11. 71.4% of utilities and 66.7% of communication services stocks were below their respective pre-COVID highs as of yesterday’s close. On the other hand, only 18.5% and 23.8% of S&P 500 stocks in the materials and energy sectors were below their respective highs between the start of 2019 and the end of February 2020. Additionally, 7.8% of S&P 500 stocks were between 0-5% above their pre-COVID highs (39 members).
Only one stock crossed below its pre-COVID highs for the first time since breaking above that level: MGM Resorts (MGM). However, the stock gapped higher by over 3% today, thus returning above this level. The weak performance as of late is due to a variety of factors including China’s zero-Covid policy, the broader market drawdown, and a weak reaction to the latest earnings report, even though the company beat on the top and bottom line.

One stock traded lower to enter a +2% channel relative to pre-COVID highs for the first time in a couple of months: Jack Henry (JKHY). JKHY is a payment processing and lending firm and competes with the likes of Block (SQ) and Toast (TOST). To gain access to our chart scanner tool, click here to become a Bespoke premium member today!

May 12, 2022
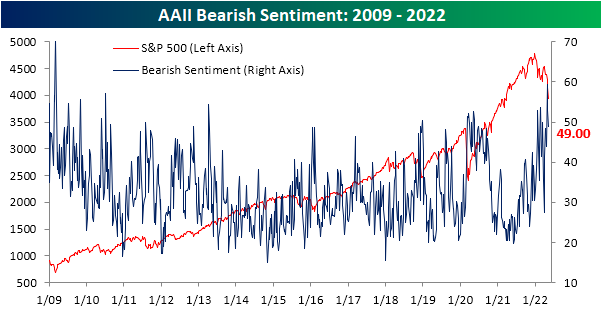
The past week may have seen the S&P 500 and other major US indices breach to fresh lows on steep declines that are nearing bear market territory, but the AAII sentiment survey has not fallen to its own lows as might have been expected. Bullish sentiment fell back below 25% this week but is still several percentage points above the lows in the teens from only a few weeks prior.

Historically, when the S&P 500 has hit 52-week lows as it has in the past week, bullish sentiment has usually been even higher with an average reading of 29.15%. The chart below shows the levels of bearish, bullish, and neutral sentiment in the AAII survey at the time the S&P 500 first traded into bear market territory (down 20% from a prior peak) for each bear market since the survey began in 1987. At 24.3% now, the current reading of bullish sentiment is on the low side compared to prior bear markets. The only two bear markets where bullish sentiment was lower were July 2008 and February 2009.

Although bullish sentiment declined, bearish sentiment also pulled back below 50% for the first time since the week of April 20th. Even with the decline, though, bearish sentiment remains at a historically high level.
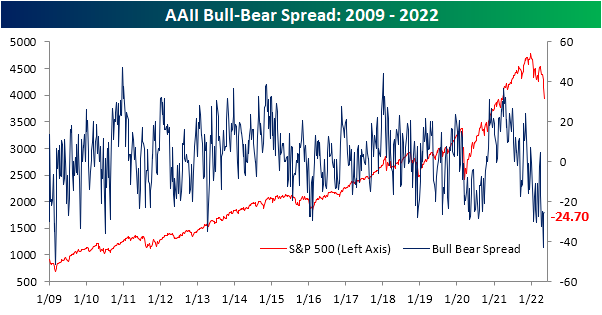
Given the moves, the bull-bear spread was higher for a second week in a row after it had reached the lowest level since March 2009 two weeks ago. Again, in spite of those improvements, the current level remains in the bottom 5% of all weeks on record.
The year is already a third over, and sentiment has found no respite after multiple months of declines in equity prices. In fact, bullish sentiment has not seen a single week with a reading above its historical average, and there has only been one such week for bearish sentiment. In the charts below, we show the average bullish and bearish sentiment reading by year since the start of the survey in 1987. While there’s still a lot of time left for things to change, with an average bullish sentiment reading of just 24.42% at this point in 2022, this year ranks as the worst year for bullish sentiment in the history of the survey (since 1987), although 1988 and 1990 have come close with average readings of around 27%. Meanwhile, the average reading on bearish sentiment has been 44.3% this year. 2008 is the only other year with a higher average reading at 45%. In other words, it is hard to find a comparable year since the late 1980s where optimism has been this low and pessimism this high. Click here to learn more about Bespoke’s premium stock market research service.

May 12, 2022
See what’s driving market performance around the world in today’s Morning Lineup. Bespoke’s Morning Lineup is the best way to start your trading day. Read it now by starting a two-week trial to Bespoke Premium. CLICK HERE to learn more and start your trial.
“Money does not buy you happiness, but lack of money certainly buys you misery.” – Daniel Kahneman

Below is a snippet of content from today’s Morning Lineup for Bespoke Premium members. Start a two-week trial to Bespoke Premium now to access the full report.
Today, the futures aren’t even attempting to sucker traders in with a rally, so maybe today, we’ll actually get a bounce. Treasuries are continuing to rally again this morning, while crude oil trades modestly lower and crypto plunges. Overnight, China pledged further support to its economy. On the geopolitical front, Finland has said it is preparing to apply for membership in NATO, and Russia has responded by threatening retaliatory steps of both military and ‘other’ measures.
We just got a chunk of economic data in the form of PPI and jobless claims. In terms of PPI. headline CPI was in line with forecasts at a m/m gain of 0.5%. Core PPI rose much less than expected at 0.4% vs 0.7%, but data for March was revised higher. In terms of jobless claims, initial claims came in 10K higher than expected 203K vs 193K while continuing claims showed another drop falling to 1.343 million versus forecasts for 1.372 million. Equity futures have seen little in the way of a reaction to the news while treasury yields remain lower.
In today’s Morning Lineup, we recap the recent developments in the crypto space (pg 4), overnight earnings (pg 5), economic data out of Europe (pg 6), and a lot more.
The year is barely more than a third over, but already the Nasdaq has had 24 different over the course of just 90 trading days. That works out to more than once a week! Again, we still have nearly two-thirds of the year left ahead of us, but already, the number of 2%+ daily declines this year ranks as the 8th highest in the Nasdaq’s history. The only years that were higher were 1999, 2000, 2001, 2002, 2008, 2009, and 2020. If, and this is a big if, the current pace of 2% declines continues, 2022 wouldn’t quite catch 2000 for the record number of 2% declines in a single year, but it would be a close second.

Start a two-week trial to Bespoke Premium to read today’s full Morning Lineup.
May 11, 2022
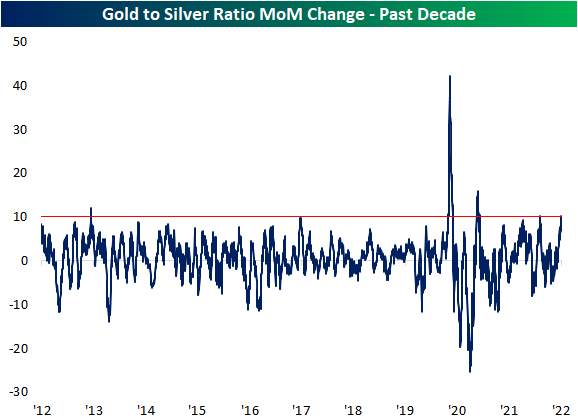
Little has been safe from heavy selling pressures recently including assets normally considered “safe havens” like precious metals. Gold is currently down over 9% from its March high while silver is down roughly 20% since its spring high. Today, both metals are bouncing from notable levels. For gold, it is finding support at its 200-DMA which also coincides with the rough uptrend line of higher lows of the past year. In addition to dramatic underperformance versus gold, silver’s test of support is perhaps a bit shakier. It is well below its moving averages, but today’s rebound is happening right around the lows from September and December. Granted, on an intraday basis, both yesterday and today’s lows breached those levels.

Given silver’s much larger decline, the ratio of gold to silver has ripped higher in the past month. In fact, the ratio has risen over 10% in the past month. The most recent 10% or larger surges were as recent as this past December with two even larger ones in the spring and fall of 2020. Prior to the pandemic, though, these sorts of rapid increases in the gold to silver ratio have been rarer. Before 2020, the only other instances of the past decade were in the springs of 2013 and 2017. Click here to learn more about Bespoke’s premium stock market research service.

May 11, 2022
The world changed dramatically with the onslaught of the COVID pandemic in early 2020. Businesses were forced to digitize, consumers saved at historic rates, the Federal Government and Federal Reserve flooded the economy with cash, new hobbies were picked up faster than a dropped hundred dollar bill, and consumers emerged from the lockdowns financially stronger than ever. Long story short, COVID appeared to permanently alter the ways in which consumers and businesses interact, and companies that stood to benefit from the new way of life saw their stocks surge while the old-economy stalwarts were crushed. That was then.
This is now. As the economy has emerged from COVID, the cost of inputs has skyrocketed, real buying power has diminished, supply chains have become strained, and geopolitical tensions are hot. Not only that, but whereas the rate of fiscal and monetary stimulus was stronger than ever during the pandemic, the headwind from their removal is as intense as it gets.
Given the shifts, a number of stocks that originally surged in the COVID world have been hit hard in the post-Covid environment, and some of the biggest COVID losers during the lockdowns have turned into market leaders. As things currently stand, 40.6% of S&P 500 members are below their pre-COVID highs (closing high price from the start of 2019 through the end of February 2020), even as the index is up 18.0% from its pre-COVID closing high on 2/19/20. Besides the fact that four out of every ten S&P 500 stocks are below their pre-COVID highs, 8.1% of the index members are within 5% of their pre-COVID high and another 7.1% are within 10% of their pre-COVID highs.
At the sector level, three sectors – Communication Services, Real Estate, and Utilities- have more than half of their components trading below their pre-COVID highs. In addition to those three sectors, in both the Consumer Discretionary and Financials sectors, more than 40% of components are below their pre-COVID highs, and another 10% of each sector’s components are within 10% of those former highs. At the other end of the spectrum, the original ‘losers’ from COVID like Energy and Materials have fewer than a quarter of their components trading below their pre-COVID highs. While it seems some days like COVID will never go away, the rallies that a large number of stocks experienced are now nothing more than memories. Click here to view Bespoke’s premium membership options.

