Jun 15, 2022
As mentioned in our piece from earlier today, gold did not necessarily deliver superior performance during the last QT cycle. This leaves investors to ponder: which asset classes did deliver substantial returns? Is there anywhere to hide? Although the macroenvironment is vastly different this time around, it is still helpful to look at past occurrences to attempt to put a frame of reference around today’s markets. Major differences include rampant inflation (particularly in commodities), supply chain constraints, lapping stimulus benefits, and weakening economic data. Below, we summarize the performance of the S&P 500, bonds, agricultural commodities, and oil during previous QT cycles.
The S&P 500 outperformed Gold during the last QT cycle, gaining 19.2%, which constitutes an annualized return of 10.1%. The graph below outlines the performance of the S&P 500 ETF (SPY) during different cycles of QE and QT. As you can see, equities were not particularly steady during the last QT cycle, but SPY gained significantly after the Fed announced its intent to slow the balance sheet winddown.

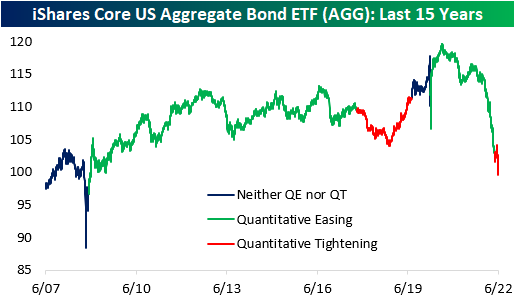
In the last QT cycle, the bond market initially sold off but managed to finish higher for the entire period. The iShares Core US Aggregate Bond ETF (AGG) bottomed at a drawdown of 4.7% about a year after the cycle began but proceeded to gain 6.7% through the final 203 trading days of the cycle. When all was said and done, AGG finished the cycle with gains of 1.7%. Similar to what we saw in gold, much of the gains were seen after the Fed announced its plan to slow the wind-down of the balance sheet. This suggests that rates rose at first but then reversed course when the Fed announced the impending end of QT. So far in the current cycle, AGG has already dropped by 2.7%, but bonds sold off hard in anticipation of QT in late 2021 and early 2022. On a YTD basis, the ETF is down a whopping 12.7%.

Agricultural commodities performed poorly during the last QT cycle, dropping 15.7%. This constitutes an annualized return of -8.9%, but the broader agricultural space was in a downtrend before QT began. Currently, agricultural commodities are in an uptrend, so it will be interesting to watch the price action as QT ramps up. On a YTD basis, the Invesco DB Agriculture Fund (DBA) is up 10.2% and is essentially flat since QT began in early May.

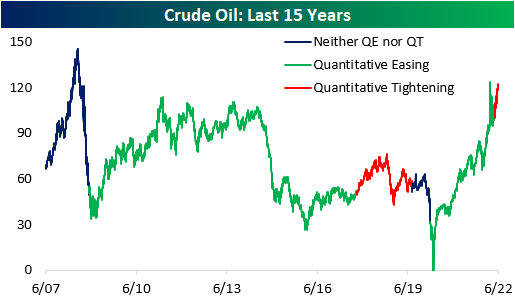
During the last QT cycle, crude oil gained 15.8%, but it would be difficult to attribute these gains to quantitative tightening. Since the Fed began tightening this year, crude oil has jumped 16.0% higher. In the last cycle, oil rallied higher before subsequently crashing, which would certainly be welcomed by many in this cycle. Click here to become a Bespoke premium member today!

Jun 1, 2022
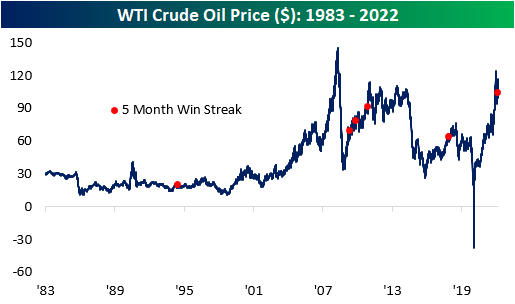
Coming out of Memorial Day weekend, WTI crude oil closed out May with its sixth straight monthly gain, resulting in the second-longest streak going back to 1983. Everyone with a car has dealt with rising costs at the pump, and the AAA national average price per gallon is currently $4.67, the highest level on record. This comes as the Biden administration has halted the importation of Russian oil, and the European Union attempts to reduce its energy dependence on Russia as well. At the same time, the reopening has caused a pick-up in demand, and the gross imbalance of supply and demand has pushed up prices to nearly unprecedented levels.

Since the US government stopped price controls on US crude oil in the early 1980s, there have only been six other periods where WTI prices rose for five or more consecutive months. As you can see from the chart below, half of these occurrences were shortly after the Global Financial Crisis, as prices rebounded from the sharp downturn in prices during the financial collapse, and the most recent was in early 2018.

Following five consecutive months of gains in oil, the average performance has been relatively weak compared to historical averages. In the first five months of each streak, oil prices have rallied by an average of 40.9% (median: 38.6%), which is nearly ten times higher than the average of all five-month periods since 1983. However, oil tends to underperform in the near term following these occurrences, registering an average loss of 3.2% and 0.8% over the next week and month, respectively. Notably, this was the only occurrence in which the price of oil climbed higher in both the following week and month, gaining 4.9% and 9.5% respectively. The only period in which the average performance was higher than that of all periods is three months, as oil has averaged a gain of 4.4% after a streak of five months is reached.

The chart below summarizes the performance one year before and after a streak of five months is reached. As you can see, oil has traded most similarly to the late 2009 occurrence, in which the price of oil rose by 15.1% in the following year. Long story short, although the average performance in these time periods is relatively weak, there isn’t a clear trend in performance in one direction or the other. Click here to become a Bespoke premium member today!

May 12, 2022
See what’s driving market performance around the world in today’s Morning Lineup. Bespoke’s Morning Lineup is the best way to start your trading day. Read it now by starting a two-week trial to Bespoke Premium. CLICK HERE to learn more and start your trial.
“Money does not buy you happiness, but lack of money certainly buys you misery.” – Daniel Kahneman

Below is a snippet of content from today’s Morning Lineup for Bespoke Premium members. Start a two-week trial to Bespoke Premium now to access the full report.
Today, the futures aren’t even attempting to sucker traders in with a rally, so maybe today, we’ll actually get a bounce. Treasuries are continuing to rally again this morning, while crude oil trades modestly lower and crypto plunges. Overnight, China pledged further support to its economy. On the geopolitical front, Finland has said it is preparing to apply for membership in NATO, and Russia has responded by threatening retaliatory steps of both military and ‘other’ measures.
We just got a chunk of economic data in the form of PPI and jobless claims. In terms of PPI. headline CPI was in line with forecasts at a m/m gain of 0.5%. Core PPI rose much less than expected at 0.4% vs 0.7%, but data for March was revised higher. In terms of jobless claims, initial claims came in 10K higher than expected 203K vs 193K while continuing claims showed another drop falling to 1.343 million versus forecasts for 1.372 million. Equity futures have seen little in the way of a reaction to the news while treasury yields remain lower.
In today’s Morning Lineup, we recap the recent developments in the crypto space (pg 4), overnight earnings (pg 5), economic data out of Europe (pg 6), and a lot more.
The year is barely more than a third over, but already the Nasdaq has had 24 different over the course of just 90 trading days. That works out to more than once a week! Again, we still have nearly two-thirds of the year left ahead of us, but already, the number of 2%+ daily declines this year ranks as the 8th highest in the Nasdaq’s history. The only years that were higher were 1999, 2000, 2001, 2002, 2008, 2009, and 2020. If, and this is a big if, the current pace of 2% declines continues, 2022 wouldn’t quite catch 2000 for the record number of 2% declines in a single year, but it would be a close second.

Start a two-week trial to Bespoke Premium to read today’s full Morning Lineup.


