Aug 9, 2022
Tomorrow, the all-too-important July CPI report comes out. Although the FOMC tends to focus more weight on personal consumption expenditures (PCE) instead of CPI, this release will give investors the first official inflation read of July. Depending on how this report comes in relative to expectations will therefore give a lot of insight into the direction/intensity of policy heading into the last four months of the year. A higher print (especially given the strength in last week’s nonfarm payroll data) would a higher likelihood for continued aggressiveness in rate hikes, while a weaker than expected print could cause markets to price in a more benign path moving forward. As of today, analysts expect headline CPI to increase 8.7% y/y, which would be a 0.4% decline from June’s rate.
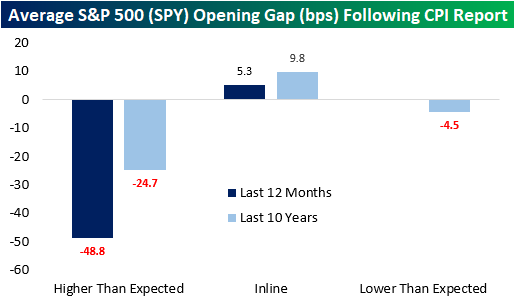
Last month, analysts expected CPI to rise 8.8% YoY, but the print came in at 9.1%. Over the last twelve months, CPI has come in hotter than expected two-thirds of the time. Notably, CPI has not come in below expectations over the last twelve months but did match expectations one-third of the time. In terms of market expectations, over the last twelve months, the S&P 500 has averaged an opening gap of -49 basis points following a CPI print that was hotter than expected. That’s about twice the average gap lower of 25 bps following all higher-than-expected prints over the last ten years. The market tends to gap higher following an inline print, averaging a gain of 5.3 bps over the last twelve months and 9.8 bps over the last ten years. Click here to learn more about Bespoke’s premium stock market research service.
Following all CPI prints over the last twelve months, the S&P 500 has tended to gap lower but move close to the break-even level in the first half hour of trading. Following this initial bounce, the S&P 00 has tended to bounce around but remain in negative territory. The second half of the trading day has been much weaker, though, finishing the day down 60 basis points on the day.

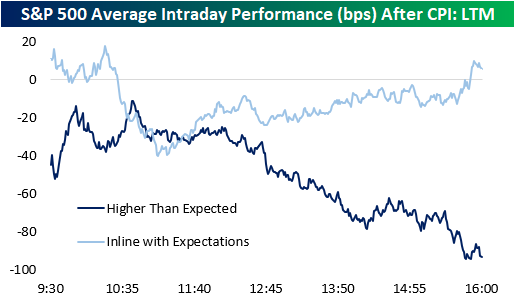
Over the last twelve months, intraday performance has diverged based on the result of the report. When CPI matches expectations (three occurrences), the S&P 500 gaps higher but has surrendered those gains by about 10:30. However, following a bottom at about 11:00, stocks tend to pick up steam throughout the rest of the trading day. When CPI comes in hotter than expected, we see nearly the exact opposite. The S&P 500 gaps lower, but generally moves higher until about 10:45, when things take a turn weaker. The back half of the trading day has been notably weaker with stocks closing right near their lows of the day, booking an average decline of 93 basis points. Click here to learn more about Bespoke’s premium stock market research service.
Aug 1, 2022
In 2022, extremely elevated gas prices have been impacting the economy, as every product-producing company has seen energy and transportation costs increase, forcing price hikes on the part of businesses simply to keep margins flat. Although there are a variety of factors affecting CPI readings, high gas prices certainly apply upward pressure. Today, gas prices are still extremely elevated compared to historical levels. At the AAA current national average of $4.22, just 1.8% of all days since the start of 2005 have seen a higher national average high, and all of them occurred this year. Click here to learn more about Bespoke’s premium stock market research service.

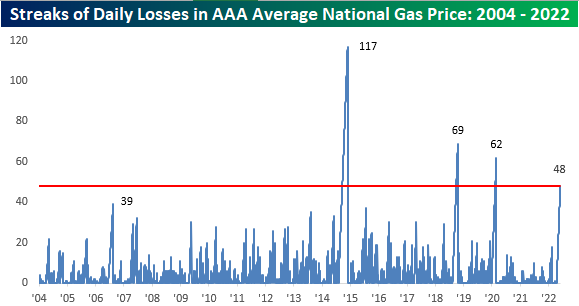
The national average price per barrel is still up 32.75% y/y, but this is actually the smallest y/y increase so far in 2022 and comes as the national average price has declined for 48 consecutive days. That’s the fourth longest streak on record. This streak is certainly notable, but gas prices are still at a level that is wearing on consumers.

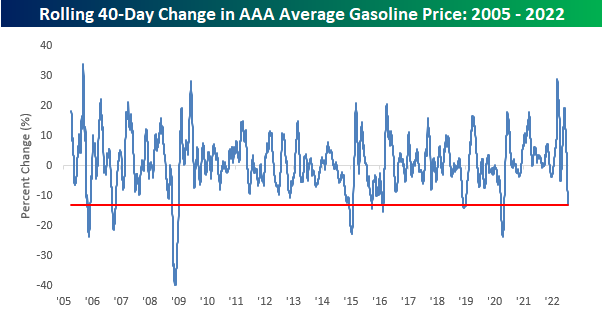
The 40-day rate of change in average gas prices (-15%) has been notable as well, with only six other periods seeing a larger decline on a percentage basis. The most recent occurred during the COVID crash when it became clear that demand was going to deteriorate due to government-imposed mandates across the globe. Consumers will hope for further declines as we begin to near the $4.00 per gallon level. Not only have prices been falling lately, but they have also been more volatile than usual, as the current 50-day standard deviation (26 cents) is 3.2 times higher than the average since 2005. Click here to learn more about Bespoke’s premium stock market research service.

Jul 25, 2022
The price of a gallon of gas, while still up YTD and relative to most other periods in the past, has pulled back considerably and consistently over the last six weeks. While a gallon of gas topped $5 in early to mid-June, over the weekend, the average price was back down to $4.36. The decline in prices has also been consistent as prices have now declined for 41 straight days. Going back to 2005, when AAA began tracking the daily national average price, this current streak now ranks as the fourth-longest on record after surpassing the 39-day streak from September 2006 over the weekend. In order for this current streak to move into the top three and oust the 62-day streak from the COVID crash, we’ll need to see another three weeks of daily declines, and in order to move into first place overall, we’d need to see the current streak nearly triple in length to 118 days and stretch out to early October!

While the current streak of declines is the fourth-longest on record, the magnitude of gasoline’s decline over the last 40 days hasn’t been quite as extreme. At -13%, there have been seven other periods where average prices at the pump experienced a larger decline over the same time period. What is notable, however, is that back in March the 40-day rate of change was the second highest on record trailing only the 33% increase that came in the wake of Hurricane Katrina in September 2005.
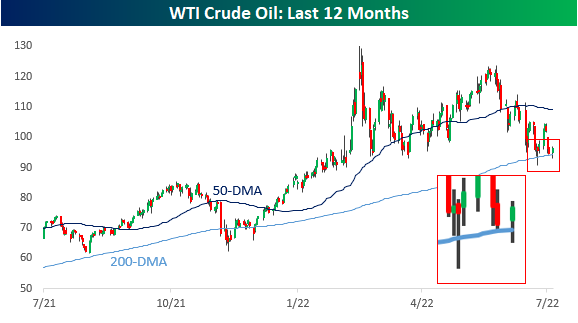
In order for prices at the pump to keep declining, we’re going to need oil prices either to stay around current levels or continue declining. Oil prices have obviously been weak for the last month or so, but over the last two weeks have shown some stabilization above the 200-DMA, including two different days when the price dropped below the 200-DMA intraday but bounced. If the 200-DMA holds in the near-term, gas prices are likely to stop declining, so this will be a key level to watch for what will ultimately determine the health of the consumer. Click here to learn more about Bespoke’s premium stock market research service.
Jun 14, 2022
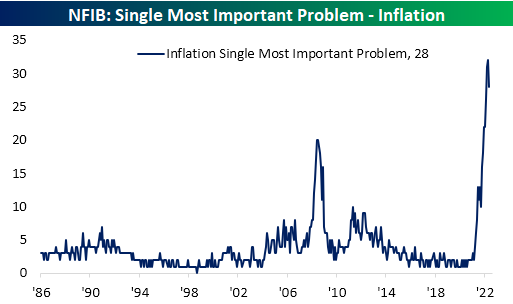
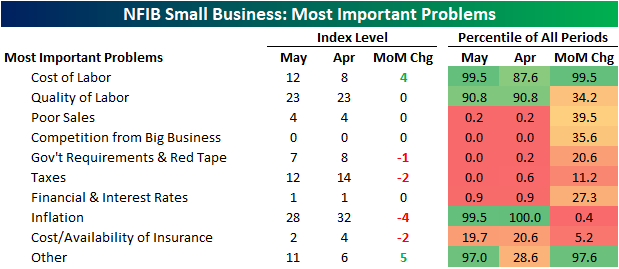
The NFIB released the results of its May survey of small businesses this morning, and even though the report showed the outlook for business conditions collapsed to a record low, there were other at least partially promising signs under the hood. Primarily, the percentage of respondents reporting inflation as their biggest concern finally appears to have peaked. After reaching a record high of almost a third of responses in April, a still-elevated but improved, 28% of small businesses reported inflation as their biggest concern. The decline in concerns over inflation ranked as the largest decline of any reported problem, but conversely, “other” saw the largest increase as it rose 5 percentage points month over month. Now at 11%, that reading is near some of the highest levels on record going back to 2008 (this response does not have as long dated of a history as the others which go back to 1986)
While the percentage of respondents reporting inflation as their biggest concern has peaked for the time being, that is not to say fewer businesses are concerned about rising costs. Behind the increase in “Other”, the next biggest month-over-month increase was cost of labor which rose four percentage points. That brings it to the highest level since December on its own as well as on a combined basis with quality of labor (which was unchanged month over month).

Inflation was not the only reading to fall month over month as fewer respondents also reported taxes as their biggest concern. Alongside another government-related reading, government requirements and red tape, the combined reading is at a record low.

Government-related indices were not alone with record low readings. 0% of respondents indicated that competition from big businesses was their most pressing issue as well while poor sales and financials & interest rates are just off record lows of their own. Click here to learn more about Bespoke’s premium stock market research service.
May 24, 2022
In addition to weaker than expected preliminary S&P Global (formerly Markit) PMIs, another weak regional Fed manufacturing index hit the tape this morning. The Richmond Fed’s Manufacturing Composite dropped into contraction in May as the index hit its lowest level in two years. The 23-point month-over-month drop was also the second-largest decline on record behind the 49-point drop in April 2020.

Each regional Fed’s headline manufacturing number differs slightly in composition and the Richmond reading is made using shipments, new orders, and employment as inputs. As shown below, each of those indices experienced historic declines this month causing the massive drop in the composite. Breadth elsewhere in the report was not much better though. Other categories like capacity utilization, order backlogs, and average workweek also pulled back sharply. Meanwhile, expectations for several categories are in the bottom few percentile of their historical ranges going back to the start of the data in the 1990s. Overall, this month’s report showed a massive slowdown in activity that is consistent with other surveys that have come out this month.

Two of the inputs to the composite that also fell into contraction this month were new orders and shipments. New Orders have seen a small handful of larger declines with September of last year being the most recent one. New Orders were also much lower after that decline last fall. As for Shipments, the 31-point month-over-month decline ranks as the second-largest on record next to April 2020 when the index fell a whopping 77 points. While it does not necessarily outweigh the rapid deterioration in demand, one silver lining of the report was a further huge improvement in supply chains. The reading on Vendor Lead Times was sliced in half as the index remains below pre-pandemic levels.

Again, Employment is the third input to the composite and it was the sole input to remain in expansion in May. That being said, it too fell sharply versus the prior month. While that reading indicates lower mid-Atlantic manufacturers are currently net taking on more workers, expectations saw a record decline meaning hiring plans are likely to decelerate significantly in the near future. That is as wage growth has stalled out and the length of the average workweek has been cut.

Finally, in spite of supply chain improvements and weaker demand, prices have continued to rise unabated. Prices paid hit fresh record highs across both current conditions and expectations. Prices received are off-peak but the reading did tick up slightly in May. Click here to learn more about Bespoke’s premium stock market research service.
