Aug 1, 2022
On Friday, the S&P 500 closed over 140 basis points higher on the back of favorable earnings from Apple (AAPL), Amazon (AMZN), Chevron (CVX) and Exxon (XOM). This was the third straight day in which the S&P 500 gained at least one percent, allowing bulls to breathe a sigh of relief after a tough start to the year. These moves came even as a second consecutive quarter of negative real GDP growth was reported and the Fed hikes rates by 75 basis points.
Friday’s move helped the S&P 500 post its best July in the post-WWII era, finishing with a gain of 9.2%. Although the index is still close to 14% off of its early January highs, the market looks more inviting than it did at the beginning of the month, when the YTD declines were above 20%. As investors, we could just give ourselves high fives for the month, but it’s vital to remain forward-looking. Following July gains of 5%+, the S&P 500 has averaged a gain of 0.6% in August (median: +1.4%), performing positively 60 percent of the time. Between the start of August and the end of the calendar year, the index has averaged a gain of 8.0% (median: +10.0%), gaining 80% of the time. Over the following twelve months (starting in August), the index has averaged an impressive gain of 15.6% (median: +15.4%), rallying 87% of the time. Based on past history, bull runs in July tend to bode well for the market for both the rest of the year and over the following twelve months. Click here to learn more about Bespoke’s premium stock market research service.

Jul 19, 2022
Following earnings in recent days, both Goldman Sachs (GS) and Citigroup (C) have seen their stocks rip higher, resulting in rarely seen price moves for the stocks. Goldman’s trading segment benefited from increased trading volumes in FX, rate, and commodity markets, helping to fuel a beat on the top and bottom line. C also reported a top and bottom line beat, and every segment saw revenue rise y/y. Click here to view an in-depth analysis of these two earnings reports. Click here to learn more about Bespoke’s premium stock market research service.
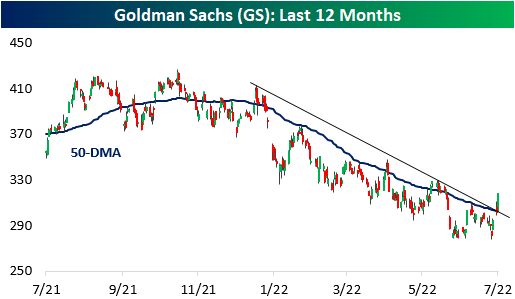
Since the close on July 14th (three trading days ago), GS has ripped 12.5% higher which is the largest three-day rally since May 2020. On its earnings reaction day (7/18), the stock gapped up over four percent but finished the day with a gain of 2.6%. Today, GS jumped an additional 5.5% higher. Notably, the stock has now broken its downtrend and its 50-day moving average, a bullish technical sign for the stock. However, the stock is still down close to 20% on the year, which is worse than the performance of the broader financial sector ETF (XLF).
Following three-day gains of over 12% for GS (for the first time in at least a month), the stock has underperformed its all-period performance on a median basis across each time period we looked at (one day, one week, one month, and three months). Positivity rates are lower as well, so it’s hard to view this occurrence as an overly optimistic signal. One data point to take note of is that the average absolute three-month change is significantly elevated at 20.5% (median: 21.6%). For all periods since its IPO, the average absolute three month price change has been 12.9% (median: 10.1%). If the historical pattern holds, this would suggest that the next three months for the stock will be more volatile than normal. Click here to learn more about Bespoke’s premium stock market research service.

Citi’s chart looks quite similar, and its rally has been even more impressive than the rally in GS as the stock also broke above both the 50-DMA and the downtrend that has been in place since early January. With a gain of 17%, the stock has seen its largest three-day rally since the days coming off the COVID lows in March 2020. Both stocks have also struggled to definitively break through the 50-DMA, so investors should watch these levels carefully over the next few trading sessions. For both stocks, the 50-DMA is still moving lower, but the performance over the last few trading sessions certainly helps the technical picture.

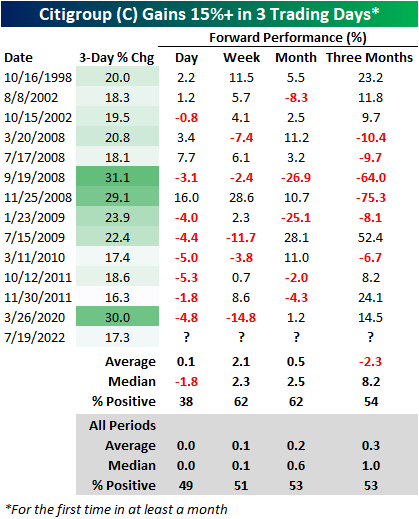
In terms of forward returns, C has had mixed performance following prior three-day gains of at least 17.0%. The table below shows all prior occurrences since the October 1998 merger between Travelers and Citigroup. Of the thirteen prior occurrences, C’s median next-day performance has been a loss of 1.8%, but the stock has booked a median gain of 2.3% over the following week. Over the next three months, C underperforms all periods on an average basis but significantly outperformed on a median basis, and positivity rates have been narrowly above that of all periods. Three months out, C has averaged an absolute move of 24.5% (median: 11.8%), which like GS, is much higher than the 13.2% (median: 9.1%) average absolute three-month change for all periods. Long story short, although the technical picture has improved for both GS and C, investors should continue to expect volatility ahead.
May 24, 2022
It seems like a distant memory now, but Monday’s rally marked just the 13th time all year (and over the last 100 trading days) that the S&P 500 tracking ETF (SPY) opened higher and traded in positive territory all day (‘100% positive day’). The chart below shows the rolling 100-trading day total number of 100% positive days for SPY since 1994, shortly after the ETF launched. The current level of 13 is already well below the long-term average of 18, but last week, the reading was even lower at 12. The last time the 100-day rolling total was lower than that was in May 2009, and the lowest readings ever recorded were in periods beginning in October 2002 and September 2008 with just six in a 100-trading day span.
What makes the current period unique is how quickly the rate of 100% positive days has plummeted. 100 trading days ago, the rolling total was more than twice the current level at 29. Also, it was only in February 2021 (less than sixteen months ago) that the number of 100% positive days reached a record high of 33 on 2/4/21. That peak came just weeks before the Federal Government sent out the third and final round of stimulus checks. Just as massive amounts of fiscal and monetary stimulus helped to support markets during COVID, the withdrawal of these supports has introduced gravity back into the equation. Click here to learn more about Bespoke’s premium stock market research service.
