May 17, 2022
Although material cost pressures have shown some signs of alleviating (for example lumber and copper futures have been grinding lower), the cost to finance a home has only increased with the national average of a 30-year fixed-rate mortgage hovering around 5.5%. That higher cost dampens demand, and homebuilder sentiment has taken a sharp turn lower. The NAHB’s Housing Market Index fell from a top 5% reading of 77 last month all the way down to a new 52-week low of 69 this month. The index has been rolling over for some time now after peaking all the way back in November 2020, and the 8 point month over month decline in May is the worst of that span, ranking as the fourth largest monthly decline in the history of the index. Two of those larger declines came in the midst of recessions/major economic shocks—October 2001 (9/11) and April 2020 (start of the pandemic). The other largest drop was in February 2014.
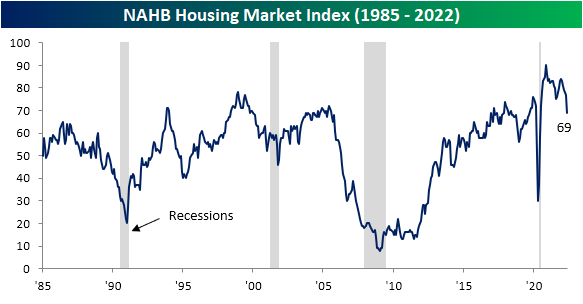
The big drop in the headline index points to a notable deterioration in reported conditions and similar drops were shared across the sub-indices. Present sales remain the most elevated with its reading of 78 managing to stay in the top decile of its historical range, but just barely so as the 8-point m/m decline also ranks as one of the largest on record. Even though reported sales are holding up decently (albeit far from improving), sentiment for future sales has collapsed. After a double-digit decline this month, the index is below its historical median meaning homebuilders are anticipating activity to slowdown in the coming months. One likely reason is that overall traffic has pulled back sharply. The 9-point month-over-month drop is tied for the second-largest decline on record.

From a geographic standpoint, this month was interesting. As with the national indices, the Midwest and West saw some of the sharpest activity pullbacks in the history of the survey. Those indices are now around similar levels to the spring of 2020. For the South, the decline did not result in an outright collapse below the post-pandemic range, but nonetheless, the decline was enormous by historic standards.
Then there’s the Northeast. While the rest of the country experienced sharp pullbacks, the Northeast index actually rose by 2 points to 76. Although the level remains middling versus its post-pandemic range, it is a notable divergence compared to the rest of the country.

In spite of the report on homebuilder sentiment, homebuilder stocks, as proxied by the iShares US Home Construction ETF (ITB), are actually higher alongside the rest of the market, currently up 1.3%. Those gains on top of the past few days’ rally appear more technical in nature than any sort of improvement in the overall backdrop for the space. As shown below, the group has been hit hard this year as mortgage rates have soared. Hardly at any point this year has the group managed to trade above its moving averages. Click here to learn more about Bespoke’s premium stock market research service.

May 16, 2022
May’s first reading on regional manufacturing activity out of New York showed significant deterioration. The New York Fed’s Empire State Manufacturing survey’s headline index dropped from a solid reading of 24.6 last month down to -11.6 in May. That is only slightly above the low from two months ago that had marked the first significant contraction in activity since the spring of 2020.

Not only are General Business Conditions back into contractionary territory, but the double-digit negative reading sits in the bottom decile of all months on record going back to the start of the index in 2001. That compares to last month’s reading which was just shy of the top decile. Given the total reversal within the historical range, the month-over-month decline of 36.2 points is now the second-largest one-month drop on record behind the 56.7 point decline in April 2020.
Only New Orders and Shipments fell enough to reach contractionary levels this month, but most other categories also saw large month-over-month declines. Expectations similarly saw broad declines, however, the categories that saw the biggest deteriorations in current conditions (General Business Conditions, New Orders, and Shipments) saw improvements in six-month expectations.
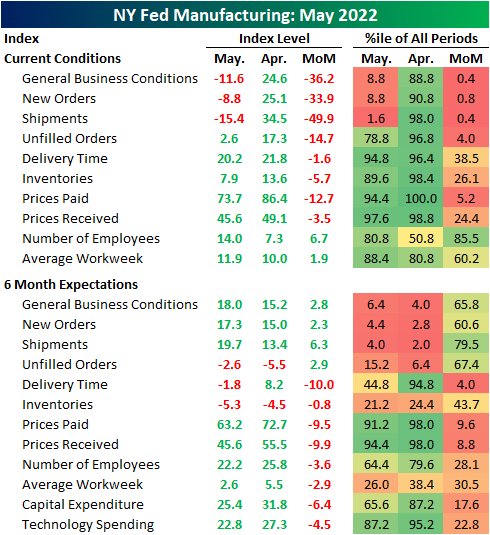
As previously mentioned, the most shocking declines were in demand-related categories, namely New Orders and Shipments. These two indices fell by 33.9 and 49.9 points, respectively. For New Orders, that was the third-largest decline on record outside of the 56-point drop in April 2020 and a 43.1-point decline in the wake of September 11, 2001. The only larger decline in Shipments happened, again, in April 2020. Unfilled Orders also fell dramatically, though the month-over-month decline was not as close to a record, and the actual level of the index is still relatively elevated in the top quartile of its historical range. Although more New York area firms reported declines in new orders and shipments, expectations were each higher month-over-month following sharp declines leading into this month’s report.

Perhaps in part due to that slow down in demand, Delivery Times continue to decelerate with the index dropping another 1.6 points. That follows a much larger double-digit decline in April. In what could be either a positive sign as a result of finally alleviated supply chains or a negative sign given slowing demand, responding firms also reported that they expect delivery times to finally decline in six months. That was the first negative reading in expectations since October 2020.

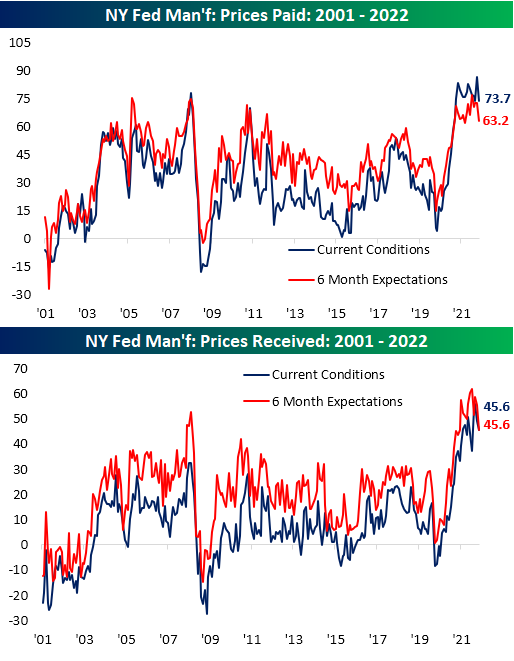
Additionally, inflationary pressures appear to be easing as both indices for Prices Paid and Received declined across current conditions and 6-month expectations. Those declines are only small dents in what have been extremely strong runs over the past two years.
Perhaps the only silver lining in this month’s report was in regards to employment. New York area firms accelerated both net hiring and the average workweek. Again though, expectations were less optimistic as those indices continue to roll over alongside plans for Technology Spending and Capital Expenditures. In other words, the employment situation may have improved in May, but that is not expected to improve dramatically in the months ahead as demand has weakened. Click here to learn more about Bespoke’s premium stock market research service.

May 12, 2022
The past week may have seen the S&P 500 and other major US indices breach to fresh lows on steep declines that are nearing bear market territory, but the AAII sentiment survey has not fallen to its own lows as might have been expected. Bullish sentiment fell back below 25% this week but is still several percentage points above the lows in the teens from only a few weeks prior.

Historically, when the S&P 500 has hit 52-week lows as it has in the past week, bullish sentiment has usually been even higher with an average reading of 29.15%. The chart below shows the levels of bearish, bullish, and neutral sentiment in the AAII survey at the time the S&P 500 first traded into bear market territory (down 20% from a prior peak) for each bear market since the survey began in 1987. At 24.3% now, the current reading of bullish sentiment is on the low side compared to prior bear markets. The only two bear markets where bullish sentiment was lower were July 2008 and February 2009.

Although bullish sentiment declined, bearish sentiment also pulled back below 50% for the first time since the week of April 20th. Even with the decline, though, bearish sentiment remains at a historically high level.
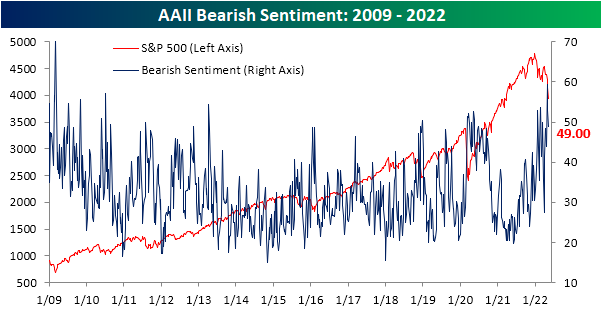
Given the moves, the bull-bear spread was higher for a second week in a row after it had reached the lowest level since March 2009 two weeks ago. Again, in spite of those improvements, the current level remains in the bottom 5% of all weeks on record.
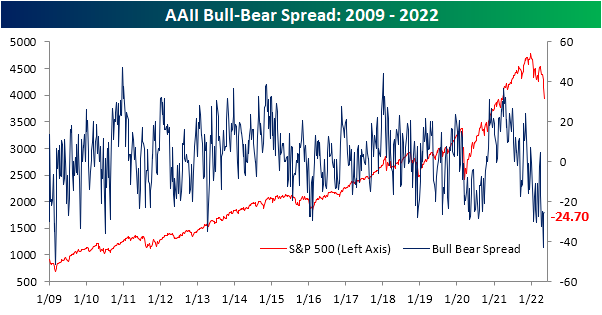
The year is already a third over, and sentiment has found no respite after multiple months of declines in equity prices. In fact, bullish sentiment has not seen a single week with a reading above its historical average, and there has only been one such week for bearish sentiment. In the charts below, we show the average bullish and bearish sentiment reading by year since the start of the survey in 1987. While there’s still a lot of time left for things to change, with an average bullish sentiment reading of just 24.42% at this point in 2022, this year ranks as the worst year for bullish sentiment in the history of the survey (since 1987), although 1988 and 1990 have come close with average readings of around 27%. Meanwhile, the average reading on bearish sentiment has been 44.3% this year. 2008 is the only other year with a higher average reading at 45%. In other words, it is hard to find a comparable year since the late 1980s where optimism has been this low and pessimism this high. Click here to learn more about Bespoke’s premium stock market research service.

May 12, 2022
Initial jobless claims came in weaker than expected this week rising to 203K instead of the expected decline to 193K. Additionally, last week’s print was revised up to 202K. While that brings claims back above the 200K level for the first time since February, the current level remains historically impressive.
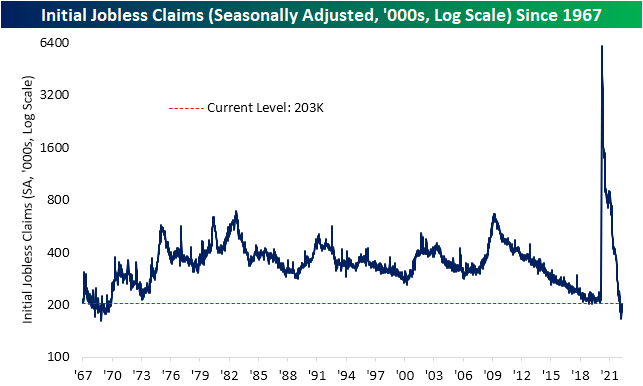
On a non-seasonally adjusted basis, claims still have seasonal tailwinds at their back, though, the winds will shift in the next few weeks. On an unadjusted basis, claims are still below 200K, dropping another 6.6K w/w to 191.8K. Behind the 182.3K reading from late March, that is the strongest reading on initial claims since 2019 and is in line with the readings for the comparable week of the year in the few years prior to the pandemic.
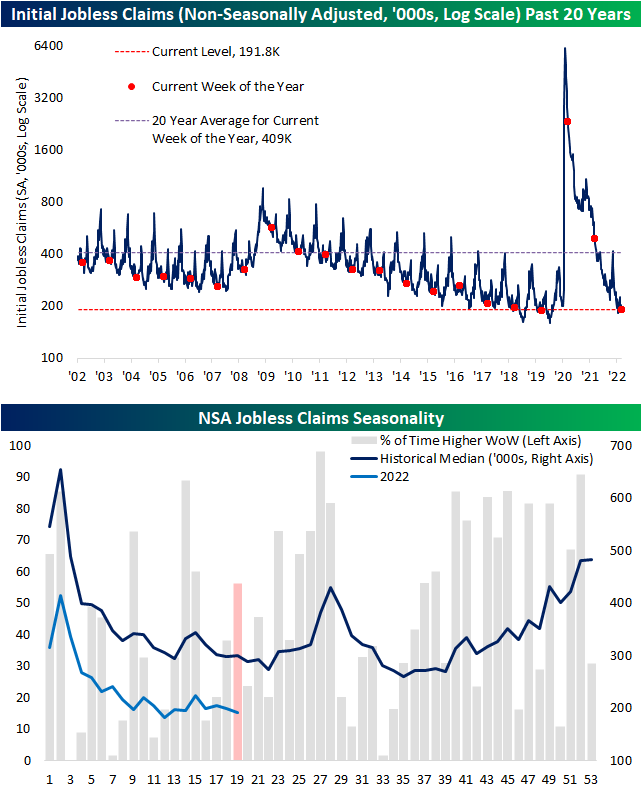
Unlike initial claims, continuing claims have continued to head lower unabated. Claims fell to 1.343 million in the most recent week marking the fifth consecutive weekly decline. Claims have not been at such a low level since late 1969/the first weeks of 1970. Click here to learn more about Bespoke’s premium stock market research service.

May 12, 2022
See what’s driving market performance around the world in today’s Morning Lineup. Bespoke’s Morning Lineup is the best way to start your trading day. Read it now by starting a two-week trial to Bespoke Premium. CLICK HERE to learn more and start your trial.
“Money does not buy you happiness, but lack of money certainly buys you misery.” – Daniel Kahneman

Below is a snippet of content from today’s Morning Lineup for Bespoke Premium members. Start a two-week trial to Bespoke Premium now to access the full report.
Today, the futures aren’t even attempting to sucker traders in with a rally, so maybe today, we’ll actually get a bounce. Treasuries are continuing to rally again this morning, while crude oil trades modestly lower and crypto plunges. Overnight, China pledged further support to its economy. On the geopolitical front, Finland has said it is preparing to apply for membership in NATO, and Russia has responded by threatening retaliatory steps of both military and ‘other’ measures.
We just got a chunk of economic data in the form of PPI and jobless claims. In terms of PPI. headline CPI was in line with forecasts at a m/m gain of 0.5%. Core PPI rose much less than expected at 0.4% vs 0.7%, but data for March was revised higher. In terms of jobless claims, initial claims came in 10K higher than expected 203K vs 193K while continuing claims showed another drop falling to 1.343 million versus forecasts for 1.372 million. Equity futures have seen little in the way of a reaction to the news while treasury yields remain lower.
In today’s Morning Lineup, we recap the recent developments in the crypto space (pg 4), overnight earnings (pg 5), economic data out of Europe (pg 6), and a lot more.
The year is barely more than a third over, but already the Nasdaq has had 24 different over the course of just 90 trading days. That works out to more than once a week! Again, we still have nearly two-thirds of the year left ahead of us, but already, the number of 2%+ daily declines this year ranks as the 8th highest in the Nasdaq’s history. The only years that were higher were 1999, 2000, 2001, 2002, 2008, 2009, and 2020. If, and this is a big if, the current pace of 2% declines continues, 2022 wouldn’t quite catch 2000 for the record number of 2% declines in a single year, but it would be a close second.

Start a two-week trial to Bespoke Premium to read today’s full Morning Lineup.