Jun 30, 2022
After two weeks of sub-20% readings, the share of respondents to the AAII sentiment survey reporting as bullish has risen back up to 22.8%. That increase in optimism comes on what has been pretty choppy price action in the past week as the S&P 500 had risen then given up roughly 3% since the last update of the AAII numbers.
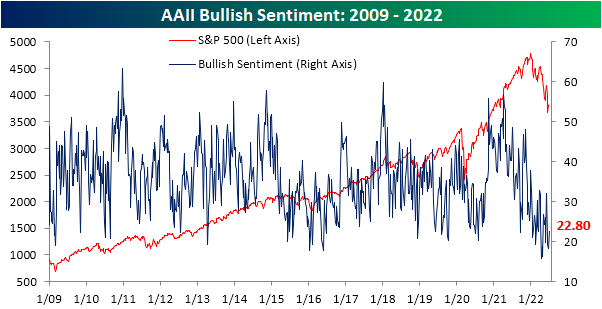
The increase in bullish sentiment broke a streak of back-to-back-to-back declines, and the opposite shift in sentiment could be seen for bearish sentiment. The percentage of respondents reporting as pessimists fell by 12.6 percentage points in the latest week bringing the reading back below 50%. While the double-digit decline was large, the first week of June actually saw an even bigger drop of 16.4 percentage points.
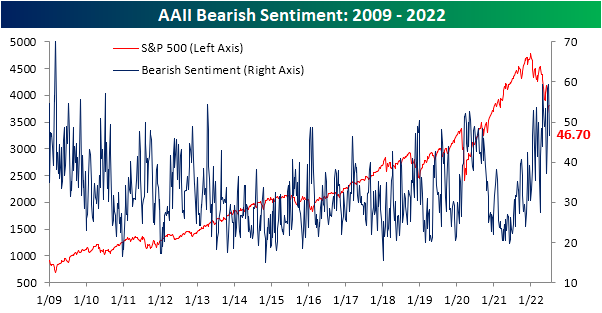
The significant inverse moves in bullish and bearish sentiment have resulted in the bull-bear spread to move higher, but at -23.9, sentiment continues to heavily favor the bears.

In fact, taking a four-week moving average of the bull-bear spread shows that the reading has been below -10 (meaning on average bears have outnumbered bulls by at least 10 percentage points) for 23 straight weeks. That continues to close in on the record six-month streak that ended in February 1991 as bulls are few and far between.

Given the drop in bears this week was far larger than the increase in the number of respondents reporting as bullish, the bulk of the sift went to the neutral camp. That reading rose 8 percentage points to 30.5%. While that only leaves the reading at the highest level since the week of June 9th, it was the largest one-week increase since the last week of March and ranks in the top decile of all week-over-week moves on record. Click here to learn more about Bespoke’s premium stock market research service.

Jun 23, 2022
Even as the ten-year yield and crude oil have pulled back over the last few trading sessions and the S&P 500 has recuperated the losses from late last week, the percentage of respondents to the AAII survey considering themselves bullish fell for the third consecutive week. This week’s reading of 18.2% marks the lowest level since late April and ranks in the bottom 1.3% of all weeks going back to the start of the survey in 1987. On the bright side, the rate of decline in bullish sentiment has been on the decline as the percentage of respondents that considered themselves bullish fell by 11 percentage points two weeks ago, 1.6 percentage points last week, and now just 1.2 percentage points this week.

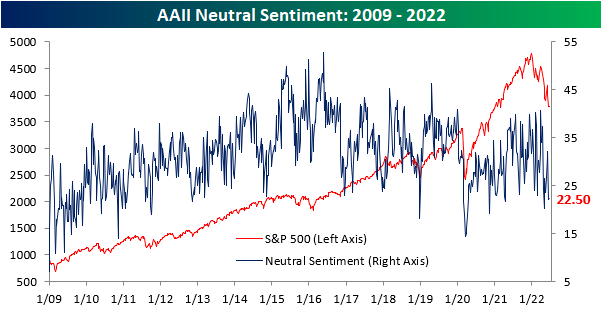
The percentage of respondents reporting neutral sentiment moved modestly higher, increasing by just 30 basis points to 22.5%. Click here to learn more about Bespoke’s premium stock market research service.
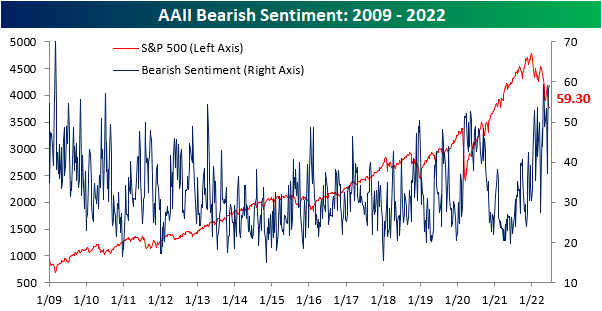
The percentage of respondents reporting bearish sentiment rose for the third consecutive week to 59.3%, the highest level since late April. The 4/28 reading was only 10 basis points higher than this week’s, so we are near the previous peak in terms of bearish sentiment. Apart from the late April reading, bearish sentiment had not topped 59% since early March of 2009. In fact, this week’s reading is in the 97th percentile of all readings since the survey began in 1987.
The bull-bear spread remains near historic lows, and there have now been 22 consecutive weeks in which the spread was below -10 (smoothed out by taking a four week moving average). We are now just four weeks away from setting a new record in this regard. The previous high was in 1991 when there were 26 consecutive weeks in which the bull-bear spread was under -10. Investors often view this as a contrarian indicator, as low readings in bullish sentiment leave upside for the market should sentiment bottom out and positive news emerge. Click here to learn more about Bespoke’s premium stock market research service.

Jun 2, 2022
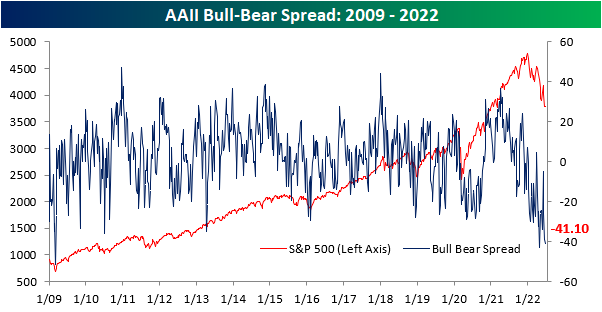
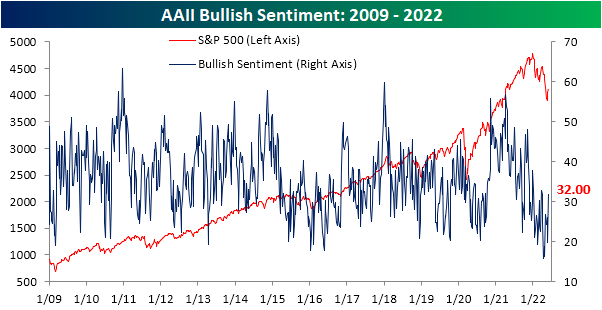
Sentiment has taken a big swing higher across surveys this week as the S&P 500 has experienced some upside mean reversion. The weekly AAII sentiment survey has seen bullish sentiment rebound from a sub-20% reading all the way back up to 32%. Relative to the historical average of 37.84%, that reading continues to show a depressed level of optimism for individual investors, but it is the strongest reading since the week of March 24th. As for the 12.2 percentage point jump in bullish sentiment week over week, it was the largest one week gain since the week of October 14th of last year when it rose 12.4 percentage points.
As bullish sentiment surged, there was a massive 16.4 percentage point drop in bearish sentiment. That was the largest one week decline in the reading on pessimism since July 15, 2010 when it fell 19.27 percentage points. Now at 37.1%, bearish sentiment is at the lowest level since the end of March.
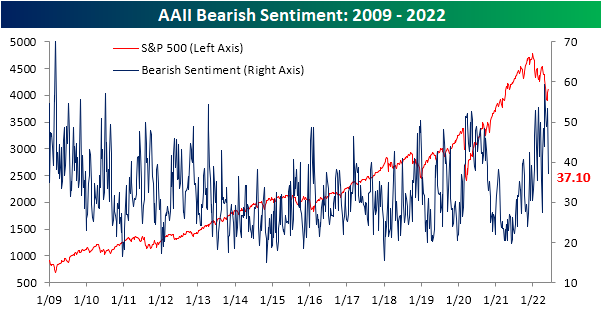
Such a large decline in bearish sentiment in only one week has pretty much been unheard of in the post Financial Crisis years. Again, July 2010 was the last time bears fell by at least 15 percentage points and before that there are only about two dozen other occurrences without another instance in the previous three months. While it was a big decline, bearish sentiment remains fairly elevated at 37.1%, but that is inline with most other occurrences since the mid 2000s whereas bearish sentiment was generally lower from the occurrences before 2005.
As for how the S&P 500 has tended to do following these massive bearish sentiment shifts, the S&P 500 has generally tended to move higher with outperformance versus the norm on a median basis one week and one month out. Although again performance is consistently positive, the size of gains have tended to be below or more inline with the norm three, six, and twelve months out from these occurrences.

After the large moves in bulls and bears this week, sentiment continues to favor pessimism but to a much smaller degree than recent weeks as the bull bear spread narrowed to -5.1 points. Click here to learn more about Bespoke’s premium stock market research service.
Apr 21, 2022
The S&P 500 is once again fighting to gain back some lost ground in the past week. That move higher has been able to lift sentiment slightly, but overall tones remain historically pessimistic. The American Association of Individual Investors weekly sentiment survey showed bulls crawl back up to 18.9% from a historic low of 15.8% reached last week. With less than a fifth of respondents bullish, this remains in the bottom 2% of all weeks on record.
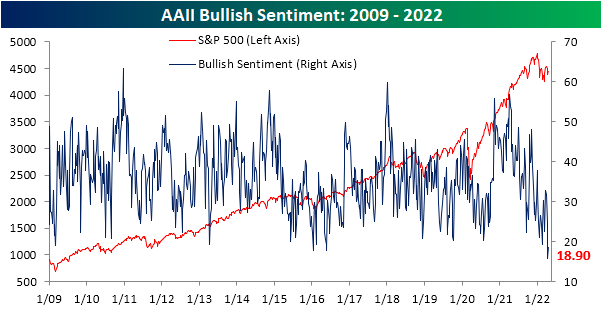
Of course, with bullish sentiment historically depressed, bearish sentiment is historically elevated at 43.9%. That is down from much higher readings of the past year that eclipsed 50% but remains just off the upper decile of its historical range.

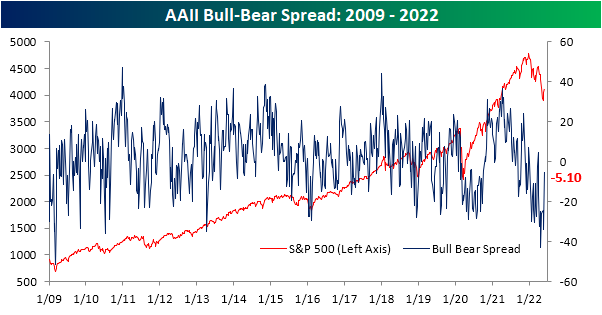
As such, bears continue to outnumber bulls by 25 full percentage points. Given the contrarian nature of sentiment indicators, that would still be taken as a positive sign for forward performance of equities as we highlighted on page 6 of last week’s Bespoke Report.

Taking into account other sentiment indicators shows a similar picture. The NAAIM Exposure Index currently sits at 74.05 which is off of the low of 30 from early March while the Investors Intelligence survey saw the first negative bull-bear spread reading in a month this week. Combining these readings, our Sentiment Composite has come off the lows but is still at one of the weaker readings of the past decade. Click here to view Bespoke’s premium membership options.

Apr 14, 2022
Heading into this week, bullish sentiment on the part of individual investors, measured by the weekly AAII survey, was already depressed with less than a quarter of respondents reporting optimistic sentiment. One week later with the S&P 500 continuing to move lower and a couple of hot, but not exactly unexpected, inflation readings in the interim, bullish sentiment has collapsed another 8.9 percentage points to the lowest level since the week of September 3rd, 1992. That’s right, bullish investor sentiment never got this low even at the depths of the pandemic, during the Global Financial Crisis, or during the Dot Com bubble burst. This week marks one of only 35 weeks since the survey began in 1987 that bullish sentiment was below 20%; the most recent being only back in February when it fell to 19.2%.
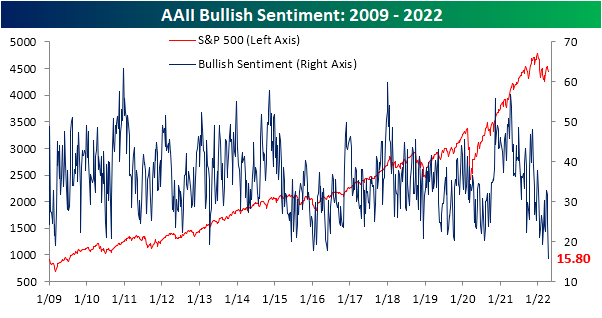
As could be expected, the huge drop and the historic low in bullish sentiment was met with a coincident increase in bearish sentiment. Bearish sentiment rose 7 percentage points to 48.4%. While that is an elevated reading, there have been a couple of even more elevated readings as recently as March 17 (49.8%), February 24 (53.7%), and January 27 (52.9%).

Even though bearish sentiment is not at a new high, the still-elevated reading on pessimism paired with the extremely depressed reading on bullishness has resulted in the bull-bear spread to fall much deeper into negative territory. Only two weeks ago, bulls actually outnumbered bears. Today, bears outnumber bulls by 32.6 percentage points. The 37 point drop since that positive reading marks the largest two-week decline in the bull-bear spread since April 2013. It is also the lowest level of the spread since that same period.

While bearish sentiment picked up, not all of those gains came from the decline in bulls. Neutral sentiment was slightly higher rising 1.8 percentage points to 35.7%. That is a few percentage points above the historical average, but it is also well below the multiple highs of the past year. You can read Bespoke’s full analysis of investor sentiment and its contrarian aspects with a two-week trial to Bespoke Premium.


