May 21, 2019
S&P 500 sector weightings are important to monitor. Over the years when weightings have gotten extremely lopsided for one or two sectors, it hasn’t ended well. Below is a table showing S&P 500 sector weightings from the mid-1990s through 2016. In the early 1990s before the Dot Com bubble, the US economy was much more evenly weighted between manufacturing sectors and service sectors. Sector weightings were bunched together between 6% and 14% across the board. In 1990, Tech was tied for the smallest sector of the market at 6.3%, while Industrials was the largest at 14.7%. The spread between the largest and smallest sectors back then was just over 8 percentage points.
The Dot Com bubble completely blew up the balanced economy, and looking back you can clearly see how lopsided things had become. Once the Tech bubble burst, it was the Financial sector that began its charge towards dominance. The Financial sector’s sole purpose is to service the economy, so in our view you never want to see the Financial sector make up the largest portion of the economy. That was the case from 2002 to 2007, though, and we all know how that ended.
Unfortunately we’ve begun to see sector weightings get extremely out of whack once again.
If you would like to see the most up-to-date numbers for S&P 500 sector weightings, simply start a two-week free trial to our Bespoke Premium or Bespoke Institutional services. Click back to this post to see the numbers once you’re signed up!

Mar 26, 2019
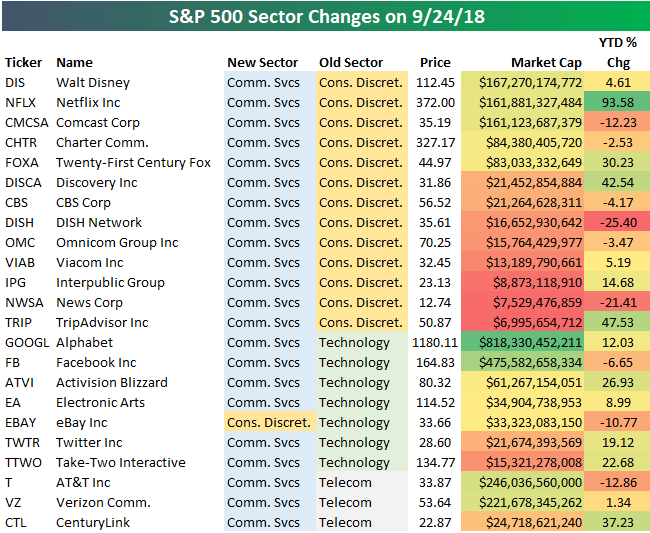
Below is a table we published last September showing the S&P 500 stocks that were impacted by the S&P GICS sector re-classifications. Twenty stocks in the index switched sectors at the time, while the three Telecom stocks remained in what became the new Communication Services sector.
Since a number of the stocks involved in the sector re-classifications were mega-caps, the switch ended up altering sector weightings in the S&P 500 quite a bit. Both Alphabet (GOOGL) and Facebook (FB) came out of the Technology sector and went into the Communication Services sector, which lowered the Tech sector’s market cap by $1.3 billion at the time. Other stocks like Disney (DIS), Netflix (NFLX), and Comcast (CMCSA) moved nearly $500 billion in market cap from the Consumer Discretionary sector to the Communication Services sector.

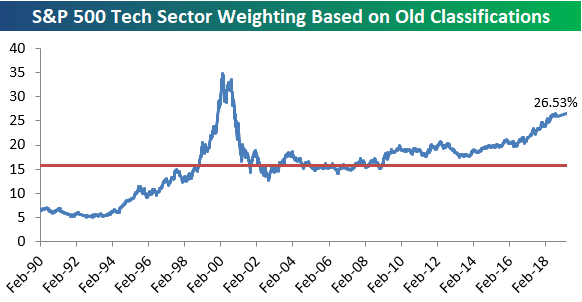
The sector re-classifications last September came at a time when the Tech sector’s weighting in the S&P 500 had ballooned up to 26% of the index. Not since the Dot Com bubble of the late 90s had Tech’s weighting been that high, so the timing of last year’s sector moves was very convenient. The re-classifications basically clipped 5 percentage points off of Tech’s weighting in the S&P, which made things look a lot less lopsided.
So what would the Tech sector’s weighting look like now if the sector re-classifications had not taken place last September? We answer that question in the chart below. Had the re-classifications not taken place, Tech would currently make up 26.53% of the S&P 500. That would be a new high for the current expansion. And the only time Tech’s weighting has been higher than this level was during a 10-month window between December 1999 and October 2000. That turned out to be quite a disastrous time to be long Tech.
Below is a chart showing current S&P 500 sector weightings based on both the old and new sector classifications. As shown, instead of 26.53% based on the old classifications, Tech has a much more digestible, but still high, 21.14% weighting in the S&P.
Health Care ranks second with a weighting of 14.56%, followed by Financials at 12.64%. Communication Services ranks 4th at 10.24%, and then Consumer Discretionary, Industrials, and Consumer Staples rank 5th through 7th. Energy, Utilities, Real Estate, and Materials combine for a weighting of about 14.5%, which is the same size as the Health Care sector on its own.
These numbers really give you a good sense of which sectors impact movements in the S&P the most, and which ones have basically no impact at all anymore.

Feb 12, 2019
S&P 500 sector weightings are important to monitor. Over the years when weightings have gotten extremely lopsided for one or two sectors, it hasn’t ended well. Below is a table showing S&P 500 sector weightings from the mid-1990s through 2016. In the early 1990s before the Dot Com bubble, the US economy was much more evenly weighted between manufacturing sectors and service sectors. Sector weightings were bunched together between 6% and 14% across the board. In 1990, Tech was tied for the smallest sector of the market at 6.3%, while Industrials was the largest at 14.7%. The spread between the largest and smallest sectors back then was just over 8 percentage points.
The Dot Com bubble completely blew up the balanced economy, and looking back you can clearly see how lopsided things had become. Once the Tech bubble burst, it was the Financial sector that began its charge towards dominance. The Financial sector’s sole purpose is to service the economy, so in our view you never want to see the Financial sector make up the largest portion of the economy. That was the case from 2002 to 2007, though, and we all know how that ended.
Unfortunately we’ve begun to see sector weightings get extremely out of whack once again.
If you would like to see the most up-to-date numbers for S&P 500 sector weightings, simply start a two-week free trial to our Bespoke Premium or Bespoke Institutional services. Click back to this post to see the numbers once you’re signed up!
Nov 19, 2018
S&P 500 sector weightings are important to monitor. Over the years when weightings have gotten extremely lopsided for one or two sectors, it hasn’t ended well. Below is a table showing S&P 500 sector weightings from the mid-1990s through 2016. In the early 1990s before the Dot Com bubble, the US economy was much more evenly weighted between manufacturing sectors and service sectors. Sector weightings were bunched together between 6% and 14% across the board. In 1990, Tech was tied for the smallest sector of the market at 6.3%, while Industrials was the largest at 14.7%. The spread between the largest and smallest sectors back then was just over 8 percentage points.
The Dot Com bubble completely blew up the balanced economy, and looking back you can clearly see how lopsided things had become. Once the Tech bubble burst, it was the Financial sector that began its charge towards dominance. The Financial sector’s sole purpose is to service the economy, so in our view you never want to see the Financial sector make up the largest portion of the economy. That was the case from 2002 to 2007, though, and we all know how that ended.
Unfortunately we’ve begun to see sector weightings get extremely out of whack once again.
If you would like to see the most up-to-date numbers for S&P 500 sector weightings, simply start a two-week free trial to our Bespoke Premium or Bespoke Institutional services. Click back to this post to see the numbers once you’re signed up!
Sep 24, 2018
The new GICS sector re-classifications finally took place today, and below are the details.
Sector classifications for public companies are determined by the Global Industry Classification Standard (GICS), which is maintained by S&P and MSCI.
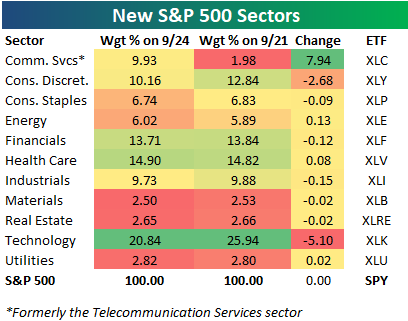
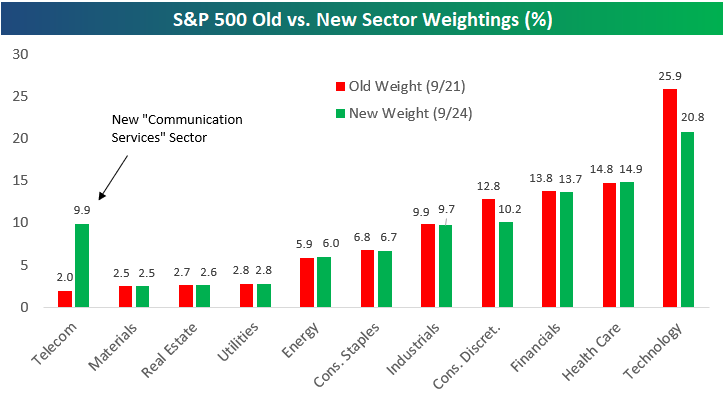
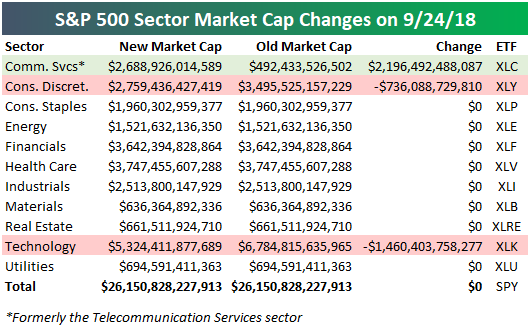
Below is a table showing S&P 500 sectors with both their new weightings and old weightings in the index. We also include the ETF that investors can use to gain exposure to each sector. As shown, the old Telecommunication Services sector is no more, and the new sector is called the Communication Services sector (ETF=XLC). The 3 Telecom stocks that made up just 1.98% of the S&P 500 as of last Friday are now part of the new Communication Services sector, which has a weighting of 9.93%. The only other sectors that are affected are Technology and Consumer Discretionary. Due to re-classifications, Technology’s weighting drops by 5.1 percentage points down to 20.84, while Consumer Discretionary’s weighting drops 2.68 percentage points down to 10.16%.
For Bespoke’s in-depth sector analysis, start a two-week free trial to Bespoke Premium.
Below we chart the data in the table above:
In terms of size, the new S&P 500 Communication Services sector has a total market cap of $2.69 trillion, which is $2.2 trillion more than the old Telecommunication Services sector’s market cap.
The Consumer Discretionary sector now has a market cap of $2.76 trillion, which is down roughly $736 billion from where it stood last Friday. The Technology sector now has a market cap $5.3 trillion, which is down $1.46 trillion.
Below are the 23 S&P 500 companies that saw sector re-classifications. The main stocks shifting from Consumer Discretionary into Communication Services are Disney (DIS), Netflix (NFLX), and Comcast (CMCSA). Others making the same shift include Charter (CHTR), Twenty-First Century Fox (FOXA), CBS, Viacom (VIAB), News Corp (NWSA), and TripAdvisor (TRIP).
Six companies are shifting from Technology into Communication Services — Alphabet (GOOGL), Facebook (FB), Activision Blizzard (ATVI), Electronic Arts (EA), Twitter (TWTR), and Take-Two Interactive (TTWO). One Tech stock — eBay — is shifting into Consumer Discretionary (joining Amazon.com).
Finally, AT&T (T), Verizon (VZ), and CenturyLink (CTL) all shift from the old Telecom sector into Communication Services.