Dec 19, 2019
Our 2020 Bespoke Report market outlook is the most important piece of research that Bespoke publishes each year. We’ve been publishing our annual outlook piece since the formation of Bespoke in 2007, and it gets better every year! In this year’s edition, we’ll be covering every important topic you can think of that will impact financial markets in 2020.
The 2020 Bespoke Report contains sections like Economic Cycles, Economic Indicators, The Fed, Sector Weightings and Technicals, Stock Market Sentiment, Housing, Commodities, and more. We’ll also be publishing a list of our favorite stocks and asset classes for 2020 and beyond.
We’ll be releasing individual sections of the report to subscribers until the full publication is completed by year-end. Today we have published the “Sector Weightings & Technicals” section of the 2020 Bespoke Report, which provides technical analysis of long-term S&P 500 sector charts, updates S&P 500 sector weightings, and highlights sector correlations in 2019 compared to correlations over the last ten years.
To view this section immediately and all other sections, become a member with our 2020 Annual Outlook Special!

Nov 7, 2019
S&P 500 sector weightings are important to monitor. Over the years when weightings have gotten extremely lopsided for one or two sectors, it hasn’t ended well. Below is a table showing S&P 500 sector weightings from the mid-1990s through 2016. In the early 1990s before the Dot Com bubble, the US economy was much more evenly weighted between manufacturing sectors and service sectors. Sector weightings were bunched together between 6% and 14% across the board. In 1990, Tech was tied for the smallest sector of the market at 6.3%, while Industrials was the largest at 14.7%. The spread between the largest and smallest sectors back then was just over 8 percentage points.
The Dot Com bubble completely blew up the balanced economy, and looking back you can clearly see how lopsided things had become. Once the Tech bubble burst, it was the Financial sector that began its charge towards dominance. The Financial sector’s sole purpose is to service the economy, so in our view you never want to see the Financial sector make up the largest portion of the economy. That was the case from 2002 to 2007, though, and we all know how that ended.
Unfortunately we’ve begun to see sector weightings get extremely out of whack once again.
If you would like to see the most up-to-date numbers for S&P 500 sector weightings, simply start a two-week free trial to our Bespoke Premium or Bespoke Institutional services. Click back to this post to see the numbers once you’re signed up!

Sep 20, 2019
S&P 500 sector weightings are important to monitor. Over the years when weightings have gotten extremely lopsided for one or two sectors, it hasn’t ended well. Below is a table showing S&P 500 sector weightings from the mid-1990s through 2016. In the early 1990s before the Dot Com bubble, the US economy was much more evenly weighted between manufacturing sectors and service sectors. Sector weightings were bunched together between 6% and 14% across the board. In 1990, Tech was tied for the smallest sector of the market at 6.3%, while Industrials was the largest at 14.7%. The spread between the largest and smallest sectors back then was just over 8 percentage points.
The Dot Com bubble completely blew up the balanced economy, and looking back you can clearly see how lopsided things had become. Once the Tech bubble burst, it was the Financial sector that began its charge towards dominance. The Financial sector’s sole purpose is to service the economy, so in our view you never want to see the Financial sector make up the largest portion of the economy. That was the case from 2002 to 2007, though, and we all know how that ended.
Unfortunately we’ve begun to see sector weightings get extremely out of whack once again.
If you would like to see the most up-to-date numbers for S&P 500 sector weightings, simply start a two-week free trial to our Bespoke Premium or Bespoke Institutional services. Click back to this post to see the numbers once you’re signed up!
Jul 2, 2019
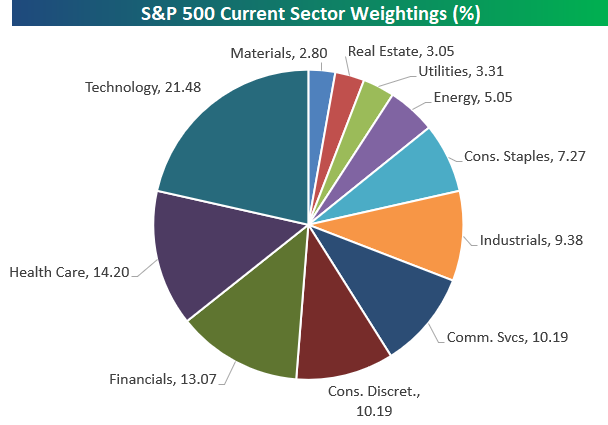
Below is an updated snapshot of S&P 500 sector weightings as of mid-year 2019. As shown, the Technology sector makes up the largest slice of the pie with a weighting of 21.48%. Health Care ranks as the second largest sector of the market at 14.20%, followed by Financials at 13.07%. The fact that technology and two service-oriented sectors making up nearly 50% of the index shows how much the US economy has shifted over the years. After the “big three” of Tech, Health Care, and Financials, we move down to Consumer Discretionary, Communication Services, and Industrials, which are all right around 10%. Consumer Staples has a weighting of 7.27%, and Energy is all the way down to 5.05% after years of losing share. Utilities, Real Estate, and Materials combine to add up to roughly 9% of the index, so these three sectors are basically immaterial at this point.
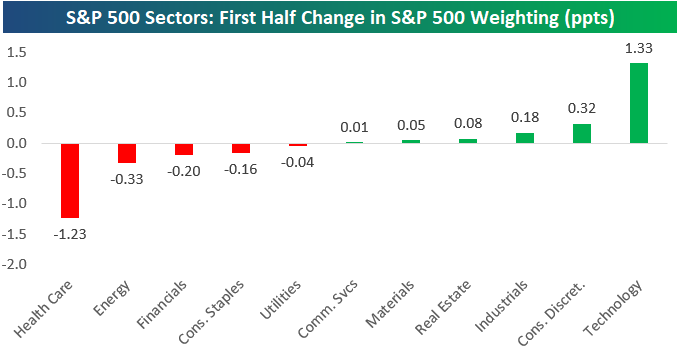
Below is a chart showing how much weightings changed in the first half of 2019. The Technology sector gained 1.33 percentage points while Health Care lost 1.23 percentage points, so the gap between the biggest sector (Tech) and the 2nd biggest sector (Health Care) widened by more than 2.5. Consumer Discretionary, Industrials, Real Estate, Materials, and Communication Services all gained share in the first half as well, while Energy, Financials, Consumer Staples, and Utilities all lost share along with Health Care. Start a two-week free trial to Bespoke Institutional for a closer look at S&P 500 sector weightings and access to ALL of our most actionable equity market research.
Jul 1, 2019
Log-in here if you’re a member with access to the Closer.
Looking for deeper insight on markets? In tonight’s Closer sent to Bespoke Institutional clients, we provide our decile analysis of the S&P 500 for the month of June. We also look to see how sectors that perform best or worst in the 1st half of the year typically perform in the 2nd half. We update S&P 500 sector weightings and how they changed in the first half, and we finish the report off with a look at today’s better than expected ISM Manufacturing report.

See today’s post-market Closer and everything else Bespoke publishes by starting a 14-day free trial to Bespoke Institutional today!