S&P 500 Average Performance by Weekday: 2019
Below is an updated look at the average performance of the S&P 500 (SPY) by weekday so far in 2019. As shown, Monday has been the only day of the trading week that has averaged a decline so far this year, but Tuesday has bounced back with an average gain of 0.12%. Wednesday has seen a small gain of 0.04%, but Thursday and Friday have both been very solid days this year. Thursday has seen the S&P average a gain of 0.16%, while Friday has closed out the week with an average gain of 0.17%. For all days this year, SPY has averaged a gain of 0.09%. That’s all you need per day to get to a 20% YTD gain through 10.5 months.

We can break the day out by opening gap versus open to close change as well. By opening gap, we mean SPY’s change from its prior day’s close to its next open. The open to close is the change from SPY’s opening price at 9:30 AM ET to its closing price at 4 PM ET. The opening gap and the open to close change combine for SPY’s full one-day change.
As noted above, Monday has been the only trading day of the week this year to average a decline. As shown below, all of that decline has come at the open of trading on Monday. SPY has averaged a gap down of 0.06% at the open on Mondays, but it has averaged an open to close gain of 0.02%. On Tuesdays, we’ve seen a reversal of Monday’s trend. SPY has averaged an opening gap of 0.12% on Tuesdays in 2019 and then a flat open to close.
Wednesday has averaged a flat open and a gain of 0.05% from the open to the close, while Thursday has averaged a gap up of 0.03% and a further gain of 0.13% from the open to the close.
Friday has seen strength at the open with an average gap higher of 0.11%. Intraday action on Fridays has been strong as well with an average open to close gain of 0.07%. With all the strength on Friday, investors haven’t been worried about holding equities over the weekend this year even with all the concerns over trade and geopolitical issues. They do come into the new trading week with some worries, though, given the Monday gaps down. Join Bespoke Premium now to get Bespoke’s most actionable stock market research. Click here to get your first 14 days free.

This Week’s Economic Indicators – 10/21/19
In spite of the focus on earnings last week, there was still a decent amount of economic data; two-thirds of which came in either weaker than expected or weaker versus their prior reading. Due to the Columbus Day holiday, Empire Manufacturing was not scheduled to release until Tuesday, but it was accidentally published midday Monday stronger than expected. Other manufacturing data released last week included the Philadelphia Fed’s manufacturing index and Industrial Production which all were weaker than expected. There were no releases on Tuesday but things picked back up on Wednesday with the release of a weaker retail sales report. It wasn’t all bad news on Wednesday, though, as the NAHB’s index on homebuilder sentiment came in at 71 compared to expectations that the index would remain unchanged at 68. Elsewhere in housing data, as expected Housing Starts are Building Permits pulled back. The final release of the week, the Leading Index, came in at -0.1% MoM compared to estimates of no change.

This week, earnings will likely continue to be a greater focus than economic data as the number of companies reporting continues to increase. There will only be 15 releases spread throughout the week with the Richmond Fed’s Manufacturing Index starting things tomorrow (there is nothing scheduled to release today). Other manufacturing data scheduled for this week include the Kansas City Fed’s index, durable and capital goods, and the preliminary Markit PMI. Following last week’s housing data, existing home sales is set to be released Tuesday, FHFA Home Price indices will be out Wednesday, and New Home Sales are due Thursday. Start a two-week free trial to Bespoke Institutional to access our interactive economic indicators monitor and much more.
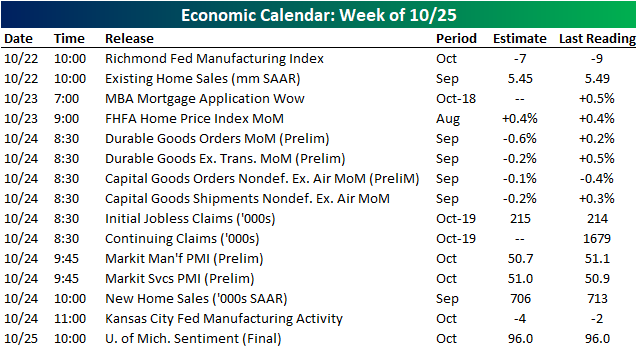
Chart of the Day: New High for the S&P 500 Cumulative A/D Line
Homebuilders on Fire, But Be Careful
The Homebuilder group has been one of the best performing areas of the stock market so far in 2019. The ETF that tracks the group — ITB — is currently up 49% YTD and 67% from its 2018 lows.
You may expect the group to be trading at multi-year highs with a rally like the one seen this year, but all this rally has done is erase a steep 40% decline experienced in 2018! As shown below, ITB has basically gone parabolic over the past few months, but it’s only just now approaching the high it made in January 2018. Start a two-week free trial to Bespoke Institutional to unlock access to our actionable research and interactive tools.

Don’t look now, but homebuilders are again approaching their all-time highs seen during the mid-2000s housing bubble as well. Investors knew it would be a long, long road to recovery following the housing crash that saw the S&P 1500 Homebuilder group fall nearly 90% from its July 2005 high. But we’re now more than 10 years removed from the ultimate low for the group, and on Friday it traded within 10% from its all-time high.

Most homebuilders that are members of the ITB ETF — shown below in our Trend Analyzer snapshot — are up more than 50% year-to-date. Every single stock in the ETF is also now trading in overbought territory, with about half of them at extreme levels (more than 2 standard deviations above their respective 50-DMAs). So while our long-term “trend” algo scores all of these stocks as being in uptrends, many of them get “poor” timing scores because of how overbought they are. When things get this extended, you typically see some downside mean reversion or at the very least, sideways trading. This mean reversion can occur from either a drop in share prices or sideways trading that allows the moving averages to catch back up.

There are some signs that maybe the homebuilders have gotten a little ahead of themselves lately. Mortgage rates have mirrored ITB closely over the last two years. In 2018, mortgage rates rose sharply, which caused the homebuilders to have a terrible year. This year we’ve seen the exact opposite, with mortgage rates dropping and homebuilders rallying. Over the last two months, however, mortgage rates have stopped falling and instead have flattened out. Homebuilders have continued to surge. You can see the divergence in the chart below which shows ITB versus the inverse of mortgage rates. If this relationship is to continue, either homebuilders need to come back down to earth a bit, or mortgage rates need to take another leg down.

Stuck in Neutral
Even after taking into account Friday’s weakness, it was mostly a positive week for the US last week as all of the major index ETFs with the exception of the Dow Jones (DIA) were up. As shown in the snapshot from our Trend Analyzer tool, outside of the Nasdaq 100 (QQQ), every major US index ETF is kicking off the week in neutral territory. Not a terribly exciting backdrop but it’s one you would expect in an environment where equities have been stuck in a seemingly never-ending range.

Just about every major US index ETF is stuck in neutral, but sector performance has varied a bit more. Last week, Energy (XLE), Technology (XLK), Consumer Staples (XLP), and Utilities (XLU) were all down, while Health Care (XLV) rallied more than 2%. In most cases, the performance of individual sectors last week involved some reversion as Health Care has been one of the weaker sectors YTD and Technology, Consumer Staples, and Utilities have been leaders. In the case of Energy, though, it has just been a continuation of the weak trend. Coming into this week, Energy is the only sector below its 50-day moving average and to make matters worse, its timing score in our Trend Analyzer tool is ‘Poor’. With crude oil prices trading down nearly one percent again this morning, the sector still faces a pretty stiff headwind. While the major averages are stuck in a range, Energy has been in a seemingly never-ending downtrend. Start a two-week free trial to Bespoke Institutional to unlock access to our actionable research and interactive tools.

Bespoke’s Morning Lineup – 10/21/19
See what’s driving market performance around the world in today’s Morning Lineup. Bespoke’s Morning Lineup is the best way to start your trading day. Read it now by starting a two-week free trial to Bespoke Premium. CLICK HERE to learn more and start your free trial.

Bespoke Brunch Reads: 10/20/19
Welcome to Bespoke Brunch Reads — a linkfest of the favorite things we read over the past week. The links are mostly market related, but there are some other interesting subjects covered as well. We hope you enjoy the food for thought as a supplement to the research we provide you during the week.
While you’re here, join Bespoke Premium for 3 months for just $95 with our 2019 Annual Outlook special offer.
The League
‘The Losses Have Already Been Substantial.’ Adam Silver Addresses Fallout From the NBA-China Controversy by Sean Gregory (Time)
NBA Commissioner Adam Silver reports that the league is already losing millions in revenues in China and is willing to do so in order to stand behind its values related to freedom of expression. [Link]
Inside LeBron James’ and Adam Silver’s make-or-break moments in China by Dave McMenamin (ESPN)
A fascinating piece of reporting looking at the experience of players and league officials on the ground in Asia in the hours after the Houston Rockets’ GM tweeted support for pro-democracy protestors in Hong Kong. [Link; auto-playing video]
NBA exec: ‘It’s the dirty little secret that everybody knows about’ by Baxter Holmes (ESPN)
Sleep deprivation driven by ridiculously tight scheduling across multiple time zones and games played late into the night is a serious problem for basketball players and their teams. [Link]
The Wealthy
Credit Suisse to start charging wealthy clients for cash deposits by Joh Revill and Oliver Hirt (Reuters)
Negative interest rates are going to be passed on to high-balance deposits of more than 2mm CHF, with a 75 bps negative rate. Smaller balances will be unaffected. [Link]
Why Don’t Rich People Just Stop Working? by Alex Williams (NYT)
An investigation of why the most wealthy tend to keep earning money even though they already have so much; a human question, as much as an economic one. [Link; soft paywall]
Parenting
The New Parental Obsession: Checking Kids’ Grades Online by Julie Jargon (WSJ)
Technology now means parents can see how their kids are doing at school in near-real time, presenting parents with a difficult quandary: to check grades or leave their kids room to learn on their own. [Link; paywall]
What It’s Like To Be A Single Dad Living On Minimum Wage by Quinn Myers (Mel)
Money diaries from men who are living on the edges of what’s possible on low wages and with spiraling costs for utilities and rent. [Link]
Politics
Impeachment Could Mean Most Presidential Candidates Can’t Leave Washington, Or Talk. Sorry, Those Are (Really) The Rules. by Paul McLeod (Buzzfeed)
Senate rules require that an impeachment recommendation delivered by the House would require Senators to be in session Monday-Saturday for several weeks, taking Senators Booker, Bennet, Harris, Klobuchar, Sanders, and Warren off the campaign trail. [Link]
Justin Trudeau Is in Trouble. Voters Get to Say How Much by Theophilos Argitis, Cedric Sam and Stephen Wicary (Bloomberg)
With Canada headed to the polls tomorrow, polls show a very tight race between the reigning liberals and the right wing Conservatives, as well as a late surge from the leftward-leaning NDP. [Link; soft paywall]
Aerospace
Building China’s Comac C919 airplane involved a lot of hacking, report says by Catalin Cimpanu (ZDnet)
China’s entry into the narrow body jet market is a remarkable effort at hacking of suppliers in order to onshore all manufacturing of the plane’s components. [Link]
Human Guinea Pigs About to Embark on World’s First 20-Hour Airline Flight by Angus Whitley (Bloomberg)
Extremely efficient new planes mean the limiting condition on air service is no longer fuel, but the amount of time that humans can sit in an airplane. [Link; soft paywall, auto-playing video]
Schemes
A Guy on Reddit Turns $766 Into $107,758 on Two Options Trades by Brandon Kochkodin (Bloomberg)
Popular sub-Reddit WallStreetBets is famous for ludicrously long-odds plays by retail trades, but the most recent lottery payout is truly one of the ages. [Link; soft paywall]
How A Massive Facebook Scam Siphoned Millions Of Dollars From Unsuspecting Boomers by Craig Silverman (Buzzfeed)
San Diego’s Ad Inc. was designed to trick the elderly into signing up for “free” trials that came with a very hefty subscription on the back end and were almost impossible to cancel. [Link]
Crude
China’s Biggest Refiner to Reduce Operations After Freight Rates Skyrocket by Alfred Cang, Sharon Cho, and Serene Cheong (Bloomberg)
With freight rates surging, crude demand is softening thanks to lower refiner runs, all thanks to US sanctions on specific Chinese shipowners. [Link; soft paywall]
Economics
Housing and Recessions by Bill McBride (Calculated Risk)
An update on housing market data (very strong) and what it means for the economic outlook (recession doesn’t look particularly likely). [Link]
Social Media
TikTok has moved into Facebook’s backyard and is starting to poach its employees by Salvador Rodriguez (CNBC)
The exploding popularity of the short video app fueled by algorithms has led the firm to expand its Silicon Valley operations, picking up hiring. [Link]
Old Is New Again
The strange revival of vinyl records (The Economist)
Vinyl is still only 4% of total music sales but it’s a growing market thanks to the quality of the sound that old fashioned records put out. [Link; soft paywall]
Read Bespoke’s most actionable market research by joining Bespoke Premium today! Get started here.
Have a great weekend!
The Bespoke Report — 10/18/19
This week’s Bespoke Report newsletter is now available for members.
The S&P 500 has been a bit top-heavy this month with the largest stocks in the index driving all of its October gains. We’ve seen interest rates start to push higher finally, which has helped Financials. The homebuilders have also extended gains even though mortgage rates have stopped going down. We’d be careful getting long the builders here given how overbought they’ve gotten. We cover everything else you need to know related to trends in financial markets in our weekly Bespoke Report. To read the Bespoke Report and access everything else Bespoke’s research platform has to offer, start a two-week free trial to one of our three membership levels. You won’t be disappointed!

The Closer: End of Week Charts — 10/18/19
Looking for deeper insight on global markets and economics? In tonight’s Closer sent to Bespoke clients, we recap weekly price action in major asset classes, update economic surprise index data for major economies, chart the weekly Commitment of Traders report from the CFTC, and provide our normal nightly update on ETF performance, volume and price movers, and the Bespoke Market Timing Model. We also take a look at the trend in various developed market FX markets.

The Closer is one of our most popular reports, and you can sign up for a free trial below to see it!
See tonight’s Closer by starting a two-week free trial to Bespoke Institutional now!
Bonds Bounce Back In Fund Flows Data
The week ended October 9th saw relatively large inflows into bond funds and relatively large outflows from equity funds. Across all mutual and exchange traded funds, equity flows were in the 7th percentile of all readings since 2013, with outflows of $11.5bn. Of that total, $5.8bn was ETFs, with the lion’s share of equity fund outflows coming from domestic funds. As has so frequently been the case lately, bond funds were the exact opposite situation. Total bond fund flows across mutual funds and ETFs meant $5.8bn of new cash on the week, which is in the 64th percentile of all periods. ETFs were relatively stronger, with bond funds drawing $1.9bn of inflows, higher than more than 81% of periods since 2013. Within both ETF and combined mutual and ETF flows, municipal bonds were the standouts, with total flows in the top 10% of all periods. Since 2013, $152bn has flowed into mutual funds and ETFs that own municipal government bonds, with more than $90bn of that coming since the end of 2017. Those flows are very likely being driven by tax-advantaged buying incentivized by the changes to the tax code at the end of 2017 which ended a variety of popular state and local tax deductions. Start a two-week free trial to Bespoke Institutional to unlock access to our actionable research and interactive tools.
