Death By Amazon’s Best Performers
On Monday, we updated our popular Death By Amazon index. The index is composed of retailers that we view as most vulnerable to competition from online retail like Amazon (AMZN).
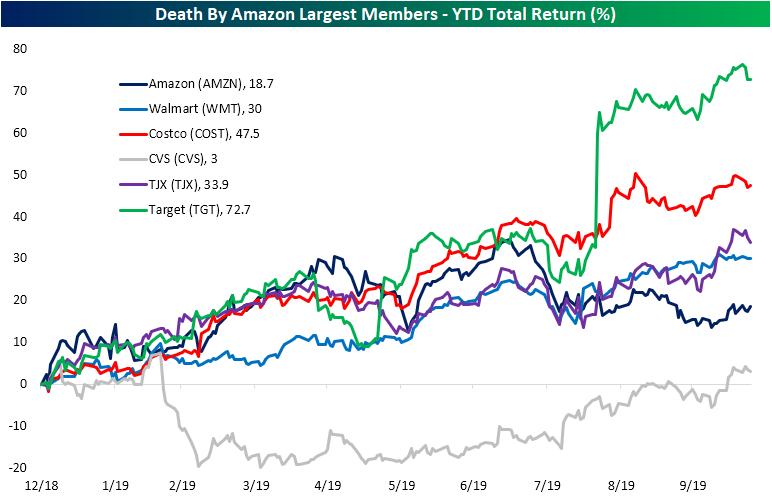
Looking at year-to-date total returns of the largest five (by market cap) members of our Death By Amazon index, Target (TGT) has ran away from the rest of the group in 2019. Including dividends, the stock has netted a 72.7% gain since the start of the year in large part due to the massive surge on earnings in the late summer. Close competitor and the largest retailer in the index, Walmart (WMT), has given investors less than half of that as WMT has returned 30% thus far in 2019. Before the earnings report that sent TGT skyrocketing, Costco (COST) had been a close contender for the highest returning spot. Currently, COST has the second best YTD return at 47.5% with TJX in third at 33.9%. On the other hand, CVS has dramatically underperformed only providing a return of 3%. Meanwhile, the namesake of the index, AMZN, actually has the second worst return in 2019 of just 18.7% YTD. Earlier this year in the spring, AMZN had actually returned the most.
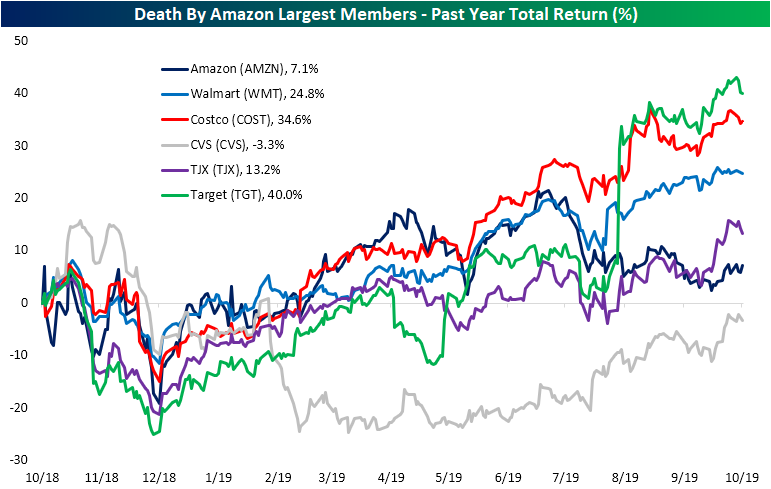
Over the past year, AMZN’s return looks even worse. Since October of last year, the stock has only returned 7.1%. While better than CVS’s 3.3% loss, each of the other largest stocks in the Death By Amazon index have offered investors more.
But over the long term, as the trend of online retail has matured, Amazon (AMZN) has offered investors a far higher return. Total return for the stock over the past five years is 514.9%. That is nearly three times more than the next best stock of these, Costco (COST), which has returned 158.5%. Start a two-week free trial to Bespoke Premium to access our Death By Amazon index as well as other B.I.G. Tips reports, interactive tools and more.

Bespoke’s Sector Snapshot — 10/24/19
Sentiment Turned Around
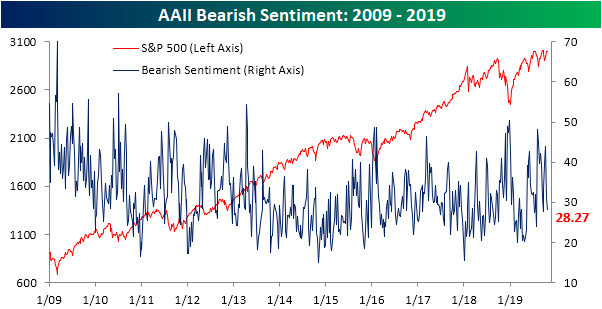
Hard to believe that only two weeks ago, AAII’s reading on market optimism fell to its lowest reading since May of 2016. Since that bottom, bullish sentiment has rebounded to 35.6%. While still below the historical average of 38.08%, the percentage of bullish investors is now at its highest level since the first week of August when it was 38.4%.

Likewise, market pessimism has fallen considerably since its recent peak of 43.96% from October 10th. Now at 28.27%, the percentage reporting as bearish is at its lowest since September 19th. Bearish sentiment is also back below its historical average for the first time since that same week.
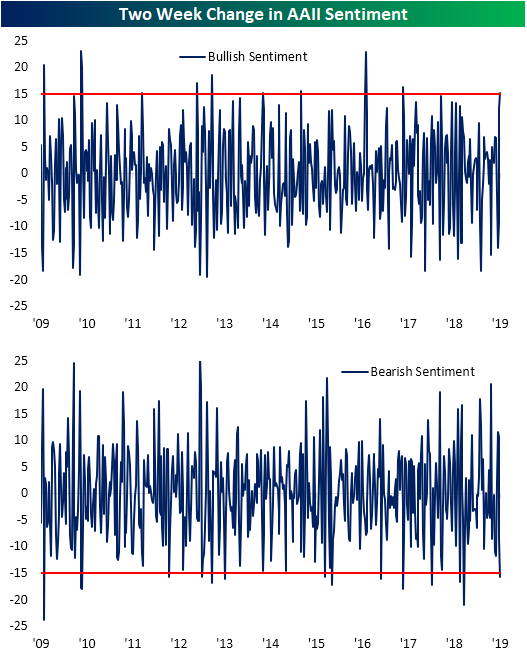
As shown in the charts below, it is not a common occurrence for either bullish or bearish sentiment to rise and fall, respectively, more than 15 percentage points in the span of just two weeks. For bearish sentiment, this was the 60th time that such a move has happened since the start of the survey with this week marking the largest two-week decline since January of this year as the market worked off of its 2018 lows. That time actually saw a larger decline of 20.93 percentage points compared to 15.69 today.
For bullish sentiment, these types of moves have actually been more common with 78 other occurrences throughout history. In spite of this, it has been much longer since the last time such a move has been observed with the last time this happened being a 16.29 percentage point rise in September of 2017. This was also the last time that both bullish and bearish sentiment simultaneously moved over 15 percentage points in two weeks.
In terms of how the market performs following such sentiment changes, the picture is mixed. The median performance of the S&P 500 has seen outperformance following similar instances one month, six months, and one year later, but underperformance over the next week and 3 months. Across each of the past 31 occurrences, the S&P 500 has been higher more than half the time with the most consistent positive performance being one month and one year later; 71% and 74.2% of the time, respectively. The other periods have been positive about 60% of the time. Start a two-week free trial to Bespoke Institutional to access our interactive economic indicators monitor and much more.

The Bespoke 50 Top Growth Stocks — 10/24/19
Every Thursday, Bespoke publishes its “Bespoke 50” list of top growth stocks in the Russell 3,000. Our “Bespoke 50” portfolio is made up of the 50 stocks that fit a proprietary growth screen that we created a number of years ago. Since inception in early 2012, the “Bespoke 50” has beaten the S&P 500 by 107.8 percentage points. Through today, the “Bespoke 50” is up 225.4% since inception versus the S&P 500’s gain of 117.7%. Always remember, though, that past performance is no guarantee of future returns. To view our “Bespoke 50” list of top growth stocks, please start a two-week free trial to either Bespoke Premium or Bespoke Institutional.

Chart of the Day: New Highs For European Stocks
Initial Jobless Claims Back Down
After last week’s reading was revised higher, this week’s reading on jobless claims saw a decline from 218K down to 212K compared to forecasts of 215K. With this reading, jobless claims remain at healthy levels and are well within the range of the past several months. Claims have now spent 241 consecutive weeks at or below 300K and 106 weeks at or below 250K. Both are record streaks.

Turning to the four-week moving average which helps to smooth out some of the week to week fluctuations, a higher print of 215K from September has rolled off of the average to be replaced by this week’s 212K. That has brought the moving average down by 0.75K week over week. While that is a small improvement near term, the overall longer-term trend for claims has yet to see any significant and consistent improvements over the past year. That being said, there has not been any deterioration either as claims have held at strong levels relative to history.
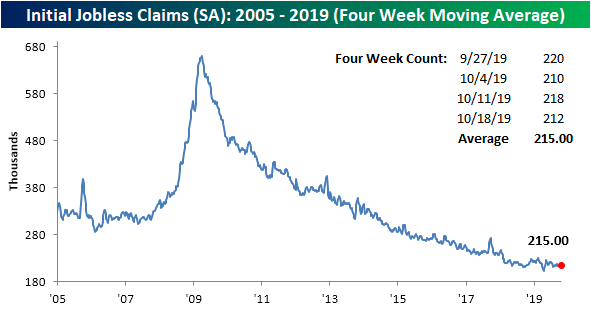
Ironically, the four-week moving average was also down 0.75K year over year with this week marking the first YoY decline in eight weeks. Just to illustrate how strong the downtrend in claims has been over the last decade, that eight-week streak was actually the longest streak of consecutive weeks where the four-week moving average was either unchanged or increasing in the last ten years.

On a non-seasonally adjusted (NSA) basis, claims fell to 186.3K this week from 201.7K last week. This was also a 12.4K decrease from the same week one year ago. Additionally, NSA claims continue to sit well below the average of 300.96K for the current week of the year since 2000. Start a two-week free trial to Bespoke Institutional to access our interactive economic indicators monitor and much more.

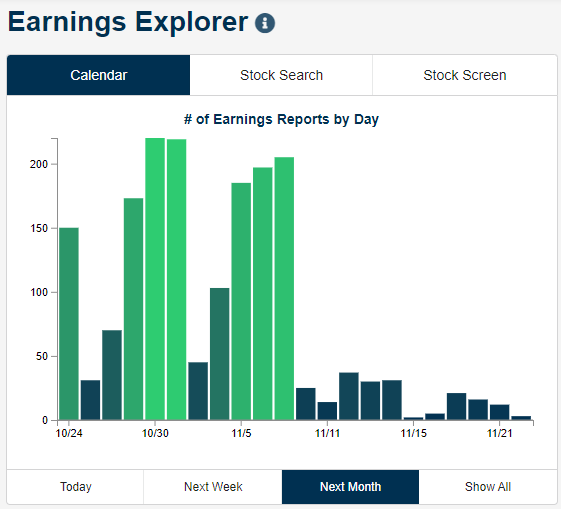
An Early Look at Earnings
We’re now in the thick of the Q3 earnings reporting period with 130 companies reporting since just the close last night. As shown in our Earnings Explorer snapshot below, earnings will be in overdrive for the next two weeks before dying down in mid-November.
Through yesterday’s close, 248 companies had reported so far this season, and 75% of them had beaten consensus bottom-line EPS estimates. However, just 63% of stocks have beaten sales estimates, and more companies have lowered guidance than raised guidance. In terms of stock price reaction to reports this season, so far investors have seen earnings as relatively bullish as the average stock that has reported has gained 0.60% on its earnings reaction day. Below we show another snapshot from our Earnings Explorer featuring the aggregate results of this season’s reports and a list of the stocks that have reacted the most positively to earnings. Four stocks so far have gained more than 20% on their earnings reaction days — PETS, BIIB, APHA, and LLNW.

We provide clients with a beat-rate monitor on our Earnings Explorer page as well. Below is a chart showing the rolling 3-month EPS and sales beat rates for US companies over the last 5 years. After a dip in the EPS beat rate earlier in the year, we’ve seen it steadily increase over the last few months up to its current level of 64.46%. That’s more than five percentage points above the historical average of 59.37%.
In terms of sales, 57.87% of companies have beaten top-line estimates over the last 3 months, which is much closer to the historical average than the bottom-line beat rate. Start a two-week free trial to Bespoke Institutional to begin using our Earnings Explorer and additional investment tools now. If you use this checkout link, you’ll receive a 10% discount on an annual membership if you stick with it past your trial period.

Europe Breaks Its Range
Just like the US equity market, European equities have been stuck in a range for the last several months, bouncing up and down between the top and bottom of a sideways trend channel. While we haven’t quite gotten there for the US market, Europe’s STOXX 600 is actually breaking out to new 52-week highs this morning (although it is still below prior highs from back in early 2018 and then early 2015 as well). Now, if only the US could follow suit.

From the perspective of a US investor, the breakout in European large-cap equities isn’t quite there yet, but it’s darn close. After adjusting for changes in the value of the dollar, the STOXX 600’s 52-week high was back in early July, and even after this morning’s gain, the index is just shy of taking out that prior short-lived peak. It may be hard to see on the large chart, so we have zoomed in on the last few days in the red-bordered inset chart in the lower right. As of this writing, the STOXX 600 is just 0.33% from a 52-week high in dollar-adjusted terms. Start a two-week free trial to Bespoke Premium to sample our most actionable investment research and receive access to all of our interactive tools. If you use this checkout link, you’ll receive a 10% discount on an annual membership if you stick with it past your trial period.

Bespoke’s Morning Lineup – 10/24/19
See what’s driving market performance around the world in today’s Morning Lineup. Bespoke’s Morning Lineup is the best way to start your trading day. Read it now by starting a two-week free trial to Bespoke Premium. CLICK HERE to learn more and start your free trial.

The Closer – Uptrends Occurring, Bye-Bye Mario, Fund Flows, Oil Import Collapse – 10/23/19
Log-in here if you’re a member with access to the Closer.
Looking for deeper insight on markets? In tonight’s Closer sent to Bespoke Institutional clients, we begin with a look across European equity markets which are beginning to break out of downtrends or sideway trends. We also take a glance around the globe at the number of global indices approaching 52-week highs. Turning to economic data we review Eurozone consumer confidence and the departure of ECB’s Mario Draghi. We finish tonight with our weekly update on ICI Fund Flows and EIA petroleum data.

See today’s post-market Closer and everything else Bespoke publishes by starting a 14-day free trial to Bespoke Institutional today!