Bespoke’s Morning Lineup – 11/5/16 – Even Small Caps Are Getting in on the Action
See what’s driving market performance around the world in today’s Morning Lineup. Bespoke’s Morning Lineup is the best way to start your trading day. Read it now by starting a two-week free trial to Bespoke Premium. CLICK HERE to learn more and start your free trial.

The Closer – Credit + Commodities = Cycle, Missing Pickup for Uber, Equal Weights – 11/4/19
Log-in here if you’re a member with access to the Closer.
Looking for deeper insight on markets? In tonight’s Closer sent to Bespoke Institutional clients, we begin with a note on where credit and commodities stand as equities reach new highs. We also recap Uber’s earnings before turning to an equal-weight breakdown of the S&P 500’s sectors. Turning to macroeconomic data, we review today’s September manufacturing data and the Federal Reserve’s quarterly survey of bank loan officers.

See today’s post-market Closer and everything else Bespoke publishes by starting a 14-day free trial to Bespoke Institutional today!
Dividend Stock Spotlight: Cisco (CSCO)
After declining alongside the rest of the market in the final quarter of 2018, Cisco (CSCO) experienced a sharp rebound in the first half of 2019. But that rally screeched to a halt in August after CSCO and competitor Arista Networks (ANET) lowered guidance citing the impact of trade issues. Whereas the stock was sitting on a 34% YTD gain at its highs in July, it is currently only up only 9.9% YTD. Without finding much relief since those declines this past summer, CSCO’s shorter-term chart has left much to be desired, but on a long-term basis, not all is lost as the stock finds itself at the bottom of the past few years’ uptrend.

Given these declines, CSCO’s valuation has become more attractive and is off the highs from earlier this year. The forward P/E ratio now sits at 14.1 which is below the average for both the Technology sector and Hardware and Equipment industry group. Likewise, the enterprise value is only 9.8x EBITDA which is also below the sector and industry group averages of 15 and 10.8, respectively.
CSCO’s dividend yield has also remained attractive at slightly less than 3%. That is not only higher than the broader S&P 500 and government bonds but is also double the average yield of other S&P 500 technology sector stocks. Cisco (CSCO) first began paying a dividend in 2011, and though that is not an exceptionally long track record, the quarterly payout has grown every year, from 6 to 35 cents per share. CSCO also looks likely to continue to be able to pay and grow this dividend seeing as the company has more cash than debt (Net debt to EBIDTA ratio is -0.5) and the payout ratio is still on the lower side at 67.5%. Start a two-week free trial to Bespoke Institutional to access our interactive Security Analysis tool, model portfolios, and more.

Chart of the Day: Beats and Misses Reacting Differently Across Sectors
B.I.G. Tips – Year Like 2019: November Edition
After breaking out to new highs last week, the equity market has followed through on its rally to start this week. As of late morning Monday, the S&P 500 was up just under 23% YTD putting it on pace for the best year since 2013 and the 12th best year in the index’s history dating back to 1928. As we highlighted in last weekend’s Bespoke Report, the latest leg higher in equities has come as sentiment among both professional and individual investors remains negative to, at best, neutral.

So how might the stock market trade for the remainder of 2019 based on the pattern we’ve seen so far this year? As we regularly do throughout the year, we ran the correlation of the closing prices of the S&P 500 so far in 2019 to the closing prices for every other year through 11/4. In our newest BIG Tips report, we have highlighted the ten years where the correlation coefficient with 2019 was the highest. For each year, we also show the S&P 500’s YTD gain through 11/4 and then how the index performed for the remainder of the year, including the maximum gain and loss from the 11/4 close through year-end. Read the report to find out if these 10 prior years that look most similar to 2019 saw further gains or a downside reversal from now through year end.
For anyone with more than a passing interest in the market’s seasonal patterns, this report is a must-read. To see it, sign up for a monthly Bespoke Premium membership now!
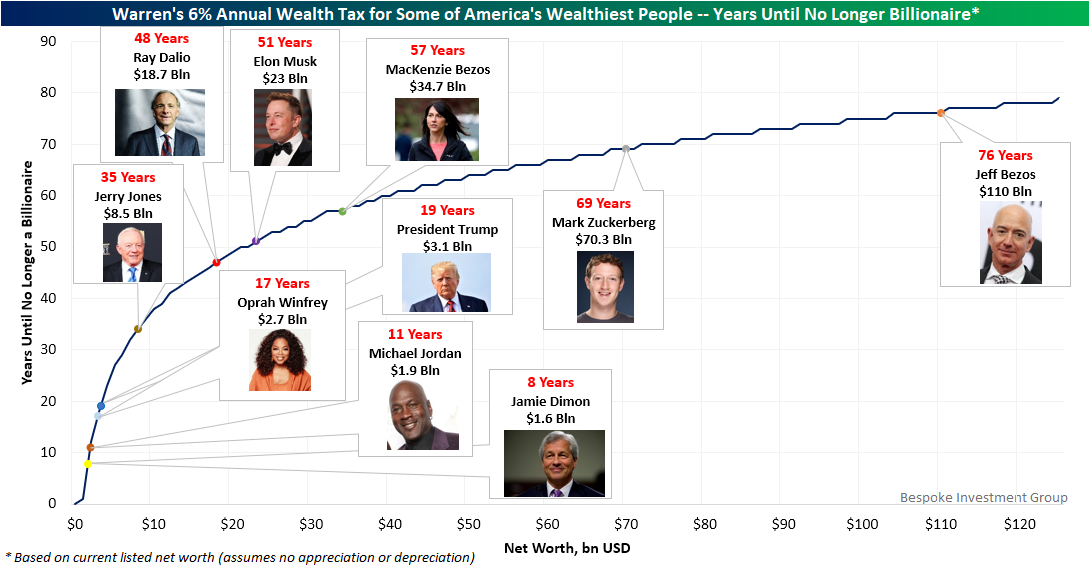
Warren’s Wealth Tax and America’s Wealthiest
Late last week, Democratic Presidential hopeful Elizabeth Warren quite literally doubled down on her proposed wealth tax, announcing that the annual tax rate on billionaire’s net worth would be 6% rather than the previously proposed 3%. Friday afternoon, we tweeted the chart below showing how many years it would take for some of America’s wealthiest people to lose their “billionaire” status given this tax’s erosion on their wealth. This is based on their current reported net worth (from a simple Google search) and doesn’t assume any appreciation or depreciation of assets from here.
Some of the most famous billionaires in the country like JP Morgan Chase CEO Jaime Dimon, Oprah, Michael Jordan, and even the President would no longer be billionaires less than 20 years down the road if taxed at Warren’s proposed 6% rate. For others like Bridgewater Associates’s (one of the world’s largest hedge funds) Ray Dalio, Dallas Cowboys owner Jerry Jones, or Tesla/SpaceX’s Elon Musk, it would take a bit longer to lose the billionaire status. As for the richest man in the world with a net worth of roughly $110 billion — Amazon’s founder Jeff Bezos — he has less to worry about as it would take just a couple years less than the average American’s lifespan to no longer be a billionaire. Granted, the first wealth tax check written to Uncle Sam would total $6.6 billion for Bezos, and that doesn’t even include other taxes (e.g., income, property, capital gains). Start a two-week free trial to Bespoke Premium to access our daily research and interactive tools.
International Exposure and Earnings
As earnings continue to roll in this earnings season, one interesting dynamic has been the contrast between the beat rates of companies based upon the share of revenues that come from abroad versus the US. Using data from our International Revenues Database to gauge international exposure and our Earnings Explorer to get third-quarter earnings results, so far this earnings season, the beat rates for companies with more than half of their revenues generated within US borders have held up much better than those with a majority of revenues coming from abroad. Heading into this week, 74.3% of companies with a greater domestic focus have reported EPS above analyst forecasts while only two-thirds of those with a more international focus have beaten estimates. That is a shift from what has typically happened so far in 2019 and illustrates the impact that the strong dollar has had on results.

As shown in the chart below, the current picture is nearly the exact opposite of where things stood a year ago when more than 74% of internationals were reporting EPS above analyst estimates. In regards to sales, although companies with domestic heavy revenues have generally seen higher beat rates, the spread between domestics and internationals has widened to more than 5 percentage points this quarter.
While this could be a result of multiple factors ranging from analysts potentially overestimating global demand to trade, the dollar is also likely a key factor. For large-cap US companies which often have multi-national exposure, movements in the currency markets often have large impacts on corporate results. For that reason, it’s extremely important for investors to know where the companies they own have the greatest exposure. One great tool to track revenue exposure is our International Revenues Database. If you don’t already have access, start a two-week free trial to Bespoke Institutional to unlock access to all of our interactive tools today!

Bespoke’s Morning Lineup – 11/4/19
See what’s driving market performance around the world in today’s Morning Lineup. Bespoke’s Morning Lineup is the best way to start your trading day. Read it now by starting a two-week free trial to Bespoke Premium. CLICK HERE to learn more and start your free trial.
Bespoke Brunch Reads: 11/3/19
Welcome to Bespoke Brunch Reads — a linkfest of the favorite things we read over the past week. The links are mostly market related, but there are some other interesting subjects covered as well. We hope you enjoy the food for thought as a supplement to the research we provide you during the week.
While you’re here, join Bespoke Premium for 3 months for just $95 with our 2019 Annual Outlook special offer.
Labor Versus Capital
Bernie Sanders Backs Deadspin Staff in Clash With Private Equity by Gerry Smith (MSN/Bloomberg)
Erstwhile sports website Deadspin was bought by private equity, and then tried to exercise editorial control. As a result the entire staff of writers and editors quit the site. [Link]
For the first time, workers are paying a higher tax rate than investors and owners by Christopher Ingraham (WaPo)
For the first time dating back to at least 1920, taxes paid on capital have fallen below those paid by labor, in aggregate, thanks to recent tax cuts for higher income earners and corporations. [Link; soft paywall]
Crime & Punishment Craziness
Police Owe Nothing To Man Whose Home They Blew Up, Appeals Court Says by Bobby Allyn (NPR)
After stealing $75 worth of merchandise and barricading themselves in a stranger’s home, Colorado police destroyed the residence. The city is now refusing to compensate the totally innocent bystander, and federal courts are siding with them. [Link]
Bill would help California’s inmate firefighters pursue career after release by Megan Cassidy (San Francisco Chronicle)
California’s inmates are often enlisted when wildfires flair up, getting paid miniscule wages. After they’re released, however, they can’t put that experience to work in helping to protect homes from fires thanks to their status as ex-convicts. [Link]
Trouble In Paradise
Elite M.B.A. Programs Report Steep Drop in Applications by Chip Cutter (WSJ)
Immigration restrictions and a general climate of hostility towards foreign visitors have gutted the application roles at the most prestigious MBA programs, with the solid domestic economy also playing a role. [Link; paywall]
Rajeev Misra Built SoftBank’s Huge Tech Fund. Now He Has to Save It. by Liz Hoffman and Bradley Hope (WSJ)
A profile of the man that has steered Soft Bank’s Vision Fund into the rocky shoals of blown up funding rounds and collapsing valuations. [Link; paywall]
Development
Libraries Are Even More Important to Contemporary Community Than We Thought by Eric Klinenberg (Literary Hub)
New research suggests that public, free institutions of learning (higher or lower) aren’t just important for loaning out books, but for establishing a hub of community contact and social engagement which can fight back against the isolation and alienation many identify as a major problem for society. [Link]
Towns to Self-Storage Facilities: Please Go Someplace Else by David Harrison (WSJ)
A boom in self storage buildings has led to pushback from local leaders who would rather see higher foot traffic, labor-intensive uses for space that is available in sometimes prime locations. [Link; paywall]
Do New Housing Units in Your Backyard Raise Your Rents? by Xiaodi Li (Fannie Mae Working Papers)
A fascinating job market paper from NYU Wagner’s Li tries to tease out the impact of new development on neighborhoods. The results are reasonably clear: more building lowers rents, attract new restaurants, and that on net existing residents see their housing expenses drop. [Link]
Social Studies
Woman Dies at Gender-Reveal Party Gone Wrong by Marie Lodi (The Cut)
Over the last couple of years there have been some wild gender reveal parties, but the most recent tragedy brings the absurdity of the stunts into focus as a woman in Iowa was killed by the pipe bomb designed to announce the gender of a couple’s new child. [Link]
‘OK Boomer’ Marks the End of Friendly Generational Relations by Taylor Lorenz (NYT)
Younger Americans are absolute exasperated with the stunts of their elders, and they’re bring the sort of snark you might expect. [Link; soft paywall]
The Internet
50 years ago today, the internet was born in Room 3420 by Mark Sullivan (Fast Company)
In 1969, a student at UCLA sent a message to a colleague at another terminal on the other side of California, the birth of ARPANET (which became the modern internet). [Link]
History In Fiction
How — and Why — Watchmen Staged an American Massacre by Rebecca Alter (Vulture)
While HBO’s Watchmen is filled with speculative fiction, the opening sequence of the series is very faithful recreation of one of the most violent, tragic, and under-discussed events in this country’s history. [Link]
Odd Tipples
Washington’s wacky booze regulation still on the books, a century after Prohibition by Don Chareunsy (The Seattle Times)
A list of hilarious and absurd regulations governing how Americans imbibe, from coast to coast. [Link]
Cash Is King
So much for a cashless society: Currency is popular again, especially the $100 bill by Leonid Bershidsky and Mark Whitehouse (LAT)
Despite the fact that more and more economic activity takes place via electronic payments of various kinds, demand for cash remains robust at 8.2% of GDP, near the highs for the past several decades. [Link]
Learn To Trade
JPMorgan Arms Coders With Trading Licenses as Quants Advance by Viren Vaghela (Bloomberg)
It turns out it’s easier to give a trading license to a coder than to give a trader lessons to code; that’s why JPM is giving some of its code-based quants the ability to trade directly. [Link; soft paywall]
Read Bespoke’s most actionable market research by joining Bespoke Premium today! Get started here.
Have a great weekend!
The Bespoke Report — 11/1/19 — The Bull is Dead, Long Live the Bull
This week’s Bespoke Report newsletter is now available for members.
They say October is a month known for turnarounds, and while this October wasn’t particularly volatile, the market sure did stage a reversal. It may seem like eons ago, but heading into October, new highs for the market seemed like the last thing we would see. The trade war was still a major worry, and the ISM Manufacturing report dropped to its lowest level since 2009. Earnings season was also coming up on the horizon, and practically nobody was expecting anything even remotely positive in what corporate America had to say about the just-completed third quarter or its outlook for the rest of the year. So, what happened? Naturally, all of that negative sentiment seems to be just what the market needed to break out of its torturous range that’s been in place since early 2018.
Will the breakout in US equities continue? That’s the question facing investors heading into the first weekend of November, and in this week’s Bespoke Report we cover the market from a variety of different angles to shed some light on that question. Topics discussed include the performance of semiconductors, earnings season, the FOMC, sentiment, seasonal trends, and market internals. So, grab some coffee and a chair and read on for our latest take. To read the Bespoke Report and access everything else Bespoke’s research platform has to offer, start a two-week free trial to one of our three membership levels. You won’t be disappointed!
