Chart of the Day: Global Indices Broadly Oversold
Bespoke’s Morning Lineup – 2/25/20 – Tepid Tuesday
See what’s driving market performance around the world in today’s Morning Lineup. Bespoke’s Morning Lineup is the best way to start your trading day. Read it now by starting a two-week free trial to Bespoke Premium. CLICK HERE to learn more and start your free trial.
Futures are attempting a turnaround this morning, but the bounce is tepid at best. That’s especially true when you consider the magnitude of yesterday’s move. Unfortunately, clarity on the coronavirus will only come with time, and that’s one thing even the Fed can’t control.
Read today’s Bespoke Morning Lineup for the latest on the impact of the coronavirus, where it’s starting to show up in economic data, and the latest stock-specific news.

Yesterday was certainly one of those days where investors threw out everything including the kitchen sink. That was not only the case in the US but also in Europe. While just 13 stocks in the S&P 500 finished up on the day yesterday, for the STOXX 600, which includes stocks from all over the continent, only six stocks finished the day higher. That combined reading of just 19 stocks was the tenth weakest single-day breadth reading for the two indices going back to 1998. The table below lists each of the prior days where the total number of advancing issues between the S&P 500 and the STOXX 600 was below 20. Prior to yesterday, the last time breadth was as weak or weaker was back in August 2015 and before that 2011.

The Closer – Volumes Soar, International Revenues Driving Declines – 2/24/20
Log-in here if you’re a member with access to the Closer.
Looking for deeper insight on markets? In tonight’s Closer sent to Bespoke Institutional clients, after stocks fell dramatically we show the surge in volumes. Next, we show a decile analysis of what factors drove today’s declines. Then we take a look at gold’s strength before pivoting over to today’s economic data from the regional Federal Reserve banks.

See today’s post-market Closer and everything else Bespoke publishes by starting a 14-day free trial to Bespoke Institutional today!
Daily Sector Snapshot — 2/24/20
Dividend and Treasury Yield Spreads At Multiyear Highs
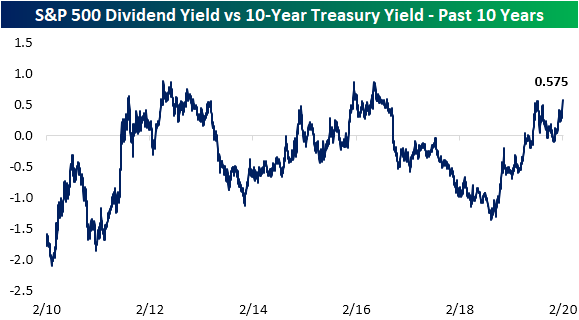
Risk assets are selling off in dramatic fashion today as the major indices are all down well over 3%. These declines have led the dividend yield on the S&P 500 to jump over 5 bps since Friday. Now at 1.94%, the S&P 500’s dividend yield is at its highest level since late October 2019.

Meanwhile, Treasury yields are cratering with the 10-Year down over 10 bps. That is the largest one-day decline in the 10-Year yield since August 14th of last year when it fell 12.43 bps. That brings the yield down to 1.37%, which is the lowest level since July 2016.

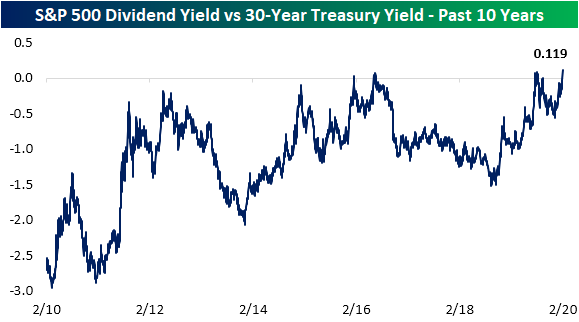
Going further out on the curve, the yield on the 30-Year Treasury bond is now at a record low of 1.82%. Similar to the 10 Year, that is nearly a 10 basis point decline from Friday.

Given these moves, holding constant the difference in risks associated with the two assets, the spread between the S&P 500’s dividend yield is higher than the 10-Year yield by its widest margin since September of 2016 at 0.575, eclipsing the previous high from last August. Prior to 2016, the spread was higher throughout much of 2012.

The spread between the S&P 500’s dividend yield and the 30-Year Treasury, on the other hand, is at its highest level in over a decade. The spread now stands at 0.119 which is the widest the spread has been since January 2009, and is favoring stocks (positive spread) for the first time since September. Unlike the spread between the S&P 500’s dividend yield and the 10-Year yield which has flipped back and forth between favoring stocks and Treasuries over the past decade, the 30-Year yield has much more consistently favored bonds. In fact, outside of today and briefly last September, the only other time we’ve seen a positive spread was in 2016. Get Bespoke’s most actionable ideas and analysis with a Bespoke Premium membership. Click here to start a two-week free trial.
B.I.G. Tips – TGIM (Thank God It’s Monday?)
Gold’s (GLD) Shiny Start
With risk assets sharply lower this morning, investors have flocked to safe havens. Treasuries are now at or near record-low yields and gold is up well over 2%. For the Gold ETF (GLD), today’s gap of 2.46% is the first gap up of 2% or more since November 9th, 2016; the day after the 2016 presidential election. Since the ETF first began trading in 2004, there have been a total of 57 days (including today and that 2016 occurrence) in which GLD has gapped up 2% or more. A little less than half (44%) of those occurrences happened during the last recession from December 2007 through June 2009. Otherwise, as shown in the chart below, these gaps have been fairly spread out without any obvious tendency to mark major tops or bottoms for the yellow metal.

Today’s gap of 2.46% is just about in line with the size of past gaps up larger than 2%. As for the rest of the day, these types of large moves at the open have not led to much further buying from open to close with an average gain of only 4 bps. GLD also only rises from open to close around half of the time. As for one week later, GLD has only been higher 48.2% of the time. Granted, the size of those pullbacks have not eaten into the gap up much with an average decline of just 11 bps (median is a 9 bps decline). Start a two-week free trial to Bespoke Institutional to access our interactive economic indicators monitor and much more.

Chart of the Day: 2% Gaps Down, When Bad News Is Good News
US Down More than China
Of all the trends swirling around in the market this morning, the performance of US and Chinese equities relative to their YTD highs has to be one of the more surprising ones. Based on where equity futures are trading this morning, the S&P 500 would be down 3.91% from its YTD highs earlier this month while the Nasdaq would be down over 5%. So how much is the Chinese market down? Barely more than 3%. Just for reference, there have been a total of more than 75,000 coronavirus cases in China so far, including more than 500 today. So far in the US, there have been a total of 35 confirmed cases. Today, with the S&P 500 set to open down more than 2.5%, China’s Shanghai Composite fell just 0.28% on the day. Start a two-week free trial to Bespoke Institutional to access our full research suite including all of our interactive tools.

Bespoke’s Morning Lineup – 2/24/20 – Taking the Elevator Down
See what’s driving market performance around the world in today’s Morning Lineup. Bespoke’s Morning Lineup is the best way to start your trading day. Read it now by starting a two-week free trial to Bespoke Premium. CLICK HERE to learn more and start your free trial.
Global equities are in a bit of a free-fall this morning on rising concerns over the spread of the coronavirus. While the pace of the outbreak certainly appears to be slowing in China, flareups in South Korea and Italy over the weekend are causing increased concern of a global spread including here in the US. As of now, there have only been 35 confirmed cases in the US, but it’s hard to imagine that number not rising. Besides the coronavirus fears, the strong performance of Bernie Sanders in Nevada over the weekend isn’t helping sentiment for the market either.
Read today’s Bespoke Morning Lineup for the latest on the impact of the coronavirus, the results of the Nevada caucuses over the weekend, and the impact of the coronavirus on supply chains.