The Closer – Stocks Surge, Sentiment Strong, Claimsonality – 12/19/19
Log-in here if you’re a member with access to the Closer.
Looking for deeper insight on markets? In tonight’s Closer sent to Bespoke Institutional clients, we take a look at the S&P 500’s price action compared to last year and relative to other years after Thanksgiving. We also show one downside of optimistic sentiment levels. Turning to macroeconomic data, we show why claims data is not surging as the numbers may appear at first glance. We finish with a look at our Five Fed Manufacturing Composite before reviewing the current account composition.

See today’s post-market Closer and everything else Bespoke publishes by starting a 14-day free trial to Bespoke Institutional today!
2020 Outlook — Thematic Performance
Our 2020 Bespoke Report market outlook is the most important piece of research that Bespoke publishes each year. We’ve been publishing our annual outlook piece since the formation of Bespoke in 2007, and it gets better every year! In this year’s edition, we’ll be covering every important topic you can think of that will impact financial markets in 2020.
The 2020 Bespoke Report contains sections like Economic Cycles, Economic Indicators, The Fed, Sector Weightings and Technicals, Stock Market Sentiment, Housing, Commodities, and more. We’ll also be publishing a list of our favorite stocks and asset classes for 2020 and beyond.
We’ll be releasing individual sections of the report to subscribers until the full publication is completed by year-end. Today we have published the “Thematic Performance” section of the 2020 Bespoke Report.
To view this section immediately and all other sections, become a member with our 2020 Annual Outlook Special!

Bespoke’s Sector Snapshot — 12/19/19
Chart of the Day: Mortgage Insurance Premium Push To Continue
No New Low in Sight For Jobless Claims
Initial jobless claims remained elevated relative to recent history this week as the seasonally adjusted number came in at 234K compared to expectations of a decline to 225K. As shown below, the four-week moving average—which offers a better look at the overall trend by smoothing out this type of week to week volatility—has been grinding higher even before the past couple of weeks’ swings. In other words, regardless of the more recent surge, claims have been trending higher in the past year.
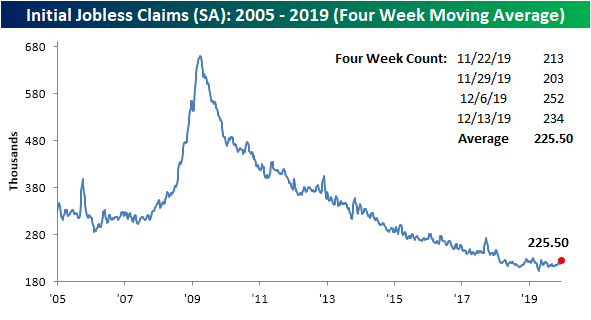
Given this, it has been some time since the four week moving average has made a new cycle low. In fact, the moving average is now 24K above the April low of 201.5K. As shown in the chart below, this is the widest spread between a weekly reading and the cycle low in more than a year, but there have also been prior times that the spread has been far wider such as in 2011, 2012, 2013, and 2017. Despite this, outside of April, most of the past year has seen claims fairly elevated above its lows.

Expanding on this, while the distance between the last low and the current level could be worse, the current streak without a new low is now the second longest of the current cycle at 35 weeks long, passing the 34 week long streak ending in May 2014. If this continues for another seven weeks, it will take out the streak lasting 42 consecutive weeks ending in December 2012.

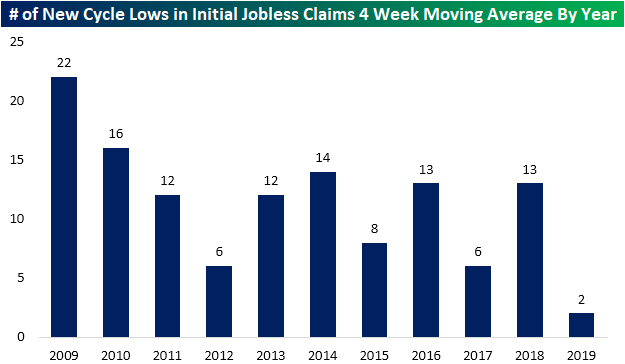
Seeing as it has been so long since we have seen a new low in the 4-week moving average for claims, it shouldn’t come as a surprise that 2019 has been relatively quiet on the new low front. In fact, there were only two weeks that saw a new low get put in place this year, both occurring in April. As shown in the chart below, no other year of the current cycle has seen so few of such weeks. Start a two-week free trial to Bespoke Institutional to access our interactive economic indicators monitor and much more.
Optimists Take Over
More fresh all-time highs, a winning streak ending at five days long, and the announcement of a trade agreement between the US and China in the past week have all contributed to sending bullish sentiment in AAII‘s weekly survey to 44.1%. That is its highest level since October of 2018 and the first time in over four weeks that bullish sentiment is above its historical average of 38.08%. This week also marked back-to-back weeks in which optimism was the predominant sentiment.

The gains in bullish sentiment have come from the bearish camp as those reporting as pessimistic fell to 20.5%, the lowest reading since the February low of 20%. At this low of a level, bearish sentiment has gotten a bit extreme at more than one standard deviation below its historical average. Meanwhile, neither bullish or neutral sentiment are at similar extremes. In other words, while sentiment may be a bit overly optimistic, it could be worse.

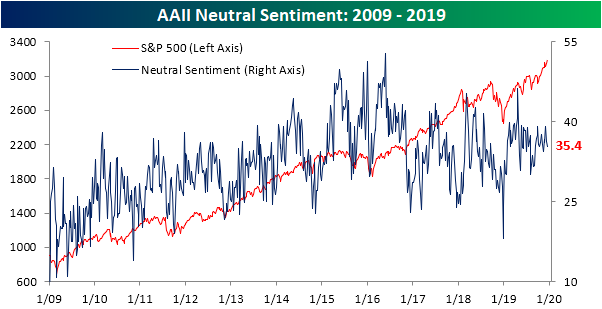
Not all of the gains in bullish sentiment came from bears. The percentage of investors reporting as neutral fell by 0.92 percentage points to 35.4%. Since that change was on the smaller side, neutral sentiment remains well within its recent range. In fact, this week marked the nineteenth consecutive week that neutral sentiment was above its historical average. Start a two-week free trial to Bespoke Institutional to access our interactive economic indicators monitor and much more.
S&P 500 Drawdowns By Year
If someone had told you on January 1st that the year would start off with fears of an economic recession in the US as Retail Sales showed their largest decline since 2009, and then that the US would be in a trade war with China where at one point the President ordered all US companies to start looking for an alternative to doing business in that country, you would have thought that 2019 would likely end up being a pretty volatile year. As if these two headwinds weren’t enough, add to them that the President would have been impeached towards year-end, and you may have even asked, “How bad was the bear market going to be?”
Well, there was no bear market in 2019, and for that matter, there wasn’t even a correction! The chart below shows the maximum drawdown of the S&P 500 from a closing high for each calendar year since 1928. The average drawdown in a given year during this span has been a decline of 16.3%, and in 58 of the 92 years, there has been a decline of at least 10%. While years with a drawdown of at least 10% aren’t uncommon, and this year there has been no shortage of potential headwinds, the maximum drawdown for 2019 has been less than 7%! While this year has been tame, don’t forget that last year, the S&P 500 saw a drawdown of 19.8% on a closing basis as many of the headwinds we faced early on in 2019 were already priced in by the end of 2018. Start a two-week free trial to Bespoke Premium to access all of our B.I.G. Tips reports, Annual Outlook Report, interactive tools, and much more.

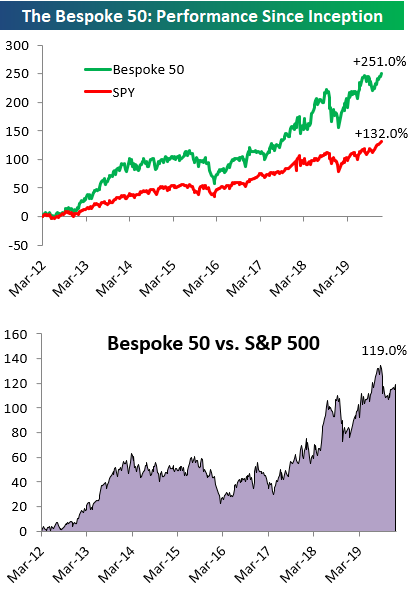
Bespoke 50 Top Growth Stocks — 12/19/19
Every Thursday, Bespoke publishes its “Bespoke 50” list of top growth stocks in the Russell 3,000. Our “Bespoke 50” portfolio is made up of the 50 stocks that fit a proprietary growth screen that we created a number of years ago. Since inception in early 2012, the “Bespoke 50” has beaten the S&P 500 by 119.0 percentage points. Through today, the “Bespoke 50” is up 251.0% since inception versus the S&P 500’s gain of 132.0%. Always remember, though, that past performance is no guarantee of future returns. To view our “Bespoke 50” list of top growth stocks, please start a two-week free trial to either Bespoke Premium or Bespoke Institutional.
Bespoke’s Morning Lineup – 12/19/19 – Individual Investors Turning More Bullish
See what’s driving market performance around the world in today’s Morning Lineup. Bespoke’s Morning Lineup is the best way to start your trading day. Read it now by starting a two-week free trial to Bespoke Premium. CLICK HERE to learn more and start your free trial.

2020 Outlook — Sector Weightings and Technicals
Our 2020 Bespoke Report market outlook is the most important piece of research that Bespoke publishes each year. We’ve been publishing our annual outlook piece since the formation of Bespoke in 2007, and it gets better every year! In this year’s edition, we’ll be covering every important topic you can think of that will impact financial markets in 2020.
The 2020 Bespoke Report contains sections like Economic Cycles, Economic Indicators, The Fed, Sector Weightings and Technicals, Stock Market Sentiment, Housing, Commodities, and more. We’ll also be publishing a list of our favorite stocks and asset classes for 2020 and beyond.
We’ll be releasing individual sections of the report to subscribers until the full publication is completed by year-end. Today we have published the “Sector Weightings & Technicals” section of the 2020 Bespoke Report, which provides technical analysis of long-term S&P 500 sector charts, updates S&P 500 sector weightings, and highlights sector correlations in 2019 compared to correlations over the last ten years.
To view this section immediately and all other sections, become a member with our 2020 Annual Outlook Special!