Bespoke’s Morning Lineup – 1/24/20 – Semis Continue to Rip
See what’s driving market performance around the world in today’s Morning Lineup. Bespoke’s Morning Lineup is the best way to start your trading day. Read it now by starting a two-week free trial to Bespoke Premium. CLICK HERE to learn more and start your free trial.

What a difference a few months makes. It was only six months ago that Intel (INTC) was starting to be considered an also-ran in the semiconductor space. After a number of management shakeups and production issues in its rollout of chips using 10nm technology, INTC was losing market share to AMD, and the stock languished. When the company reported earnings last July, its stock declined 1% in reaction to the report. While that wasn’t a sharp decline, it was the fifth time the stock had reacted negatively to earnings in the prior six quarters. Not only that, but the stock was also near 52-week lows when the Philadelphia Semiconductor Index was near 52-week highs. INTC used to be the leader in the semiconductor space, but last July it seemed to be looking more like Bethlehem Steel in the early 1990s than a leading company in the technology sector.
That report last July marked what was a low point for INTC on a relative basis, though. Ever since then the stock has been rolling, and even before last night’s earnings triple play the stock was already in the midst of a multi-year breakout that will likely look even more convincing after today. In pre-market trading, the stock has been losing some steam from its overnight highs, but it is still up over 5% after what was already a strong move heading into the report.

The Closer – Yellow Brick Road, Primary Placement, Leading Away – 1/23/20
Log-in here if you’re a member with access to the Closer.
Looking for deeper insight on markets? In tonight’s Closer sent to Bespoke Institutional clients, we begin with the implications of the uptick in Australian inflation expectations before turning to US politics. We show the current standings of the major Democratic candidates headed into the primaries. Next we recap the Conference Board’s Leading index and KC Fed manufacturing data. We finish with our weekly look at EIA data and an abridged version of our Fixed Income Weekly.

See today’s post-market Closer and everything else Bespoke publishes by starting a 14-day free trial to Bespoke Institutional today!
Bespoke’s Sector Snapshot — 1/23/20
Chart of the Day: Kirby Weathers Tanker Storm?
Sentiment Spikes
In the span of just two weeks, the percentage of respondents in AAII’s investor sentiment survey reporting as bullish has risen from the middle of the past few years’ range of 33.07% to 45.6% (and from 41.83% last week), the highest reading since early October of 2018. Back then, bullish sentiment peaked out just slightly higher at 45.66% before turning lower as stocks sharply sold off.
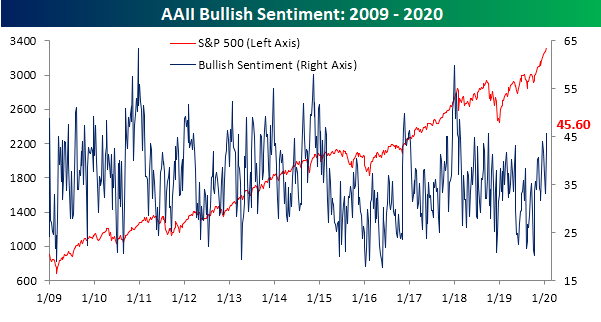
Bearish sentiment is another story. In spite of the strong bullish reading, bearish sentiment was actually lower in the final weeks of 2019 and the first week of this year. Now at 24.77%, bearish sentiment is low but still within a normal range of one standard deviation of the past year’s average of 30.04%.

Last week, we noted that AAII’s weekly reading on neutral sentiment fell below its historical average for the first time in 22 weeks. Although the week-over-week decline was fairly small at just around one percentage point this week, that slide has continued as neutral sentiment has fallen further to 29.63%. This is the first time that the sentiment reading has fallen below 30 since the first week of last year.

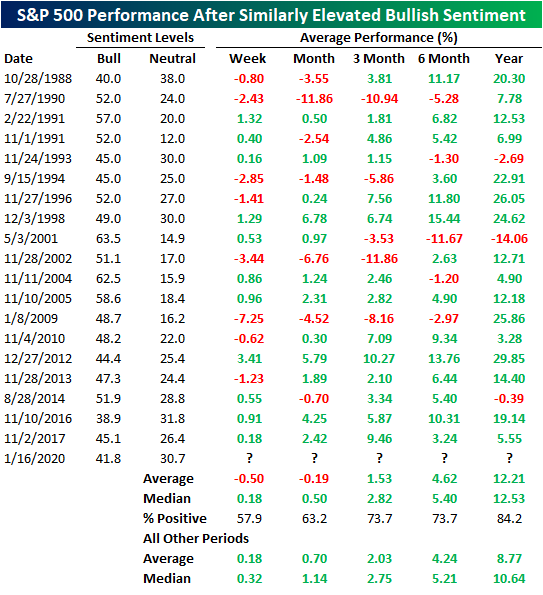
Neutral sentiment dropping so low indicates that investors have become increasingly polarized; mostly placing themselves in the bullish camp. In fact, in the past two weeks, both sentiment readings have reached fairly elevated levels relative to the past year. Bullish sentiment is now more than 1 standard deviation above the past year’s average of 33.7% while neutral sentiment is 1 standard deviation below its average of 36.26% over the past year. This was the first time this has occurred while bearish sentiment remained within its normal range since early 2018. As shown below, of the 20 prior times in the history of the survey that bullish sentiment has been similarly elevated (over 1 standard deviation above the past year’s average) while neutral sentiment is simultaneously extended below its average without having done so in the prior six months has resulted in near term underperformance compared to other periods. The S&P 500 has averaged declines in the next week and month following such readings. Fortunately, longer-term returns have been stronger and more consistently positive. Start a two-week free trial to Bespoke Institutional to access our interactive economic indicators monitor and much more.
Claims Higher As Expected
Last week, initial jobless claims fell for a fifth consecutive week reaching 204K (revised up to 205K this week) which was the lowest level since November. As expected this week, claims rose off of these lows albeit by a less than expected amount. Initial jobless claims were expected to increase to 214K but instead only rose to 211K. All in all, the picture claims are sending about the labor market is a healthy one.
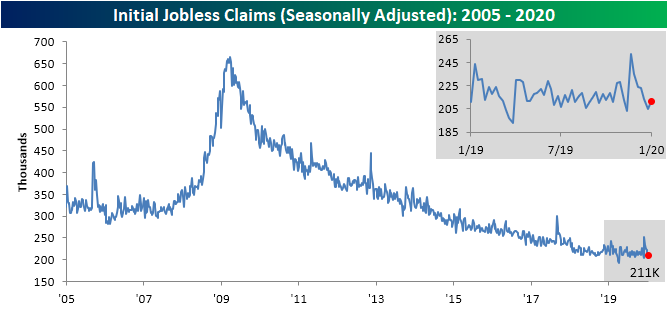
Although seasonally adjusted claims were up this week, the four-week moving average has fallen further. The moving average has fallen each of the past three weeks as the much higher readings from around Thanksgiving have rolled off the average. This week’s print brings the average to 213.25K which is the lowest since the end of September. Additionally, that is a drop of over 20K from the recent peak of 233.5K in the final week of 2019.

Non-seasonally adjusted jobless claims experienced a substantial decline of 71K this week as the indicator works off of its seasonal and annual peak that seems to have been put in place last week. Now at 267.6K, the indicator is still well below its average for the current week of the year since 2000.

Again, the 71K week-over-week drop in the non-seasonally adjusted number may sound like a significant move, but the large size of that move can mostly be boiled down to seasonality. In fact, since 2000 non-seasonally adjusted claims have averaged a decline of 147.9K in the third week of the year (current week). No other week of the year comes even close in seeing this sort of move.

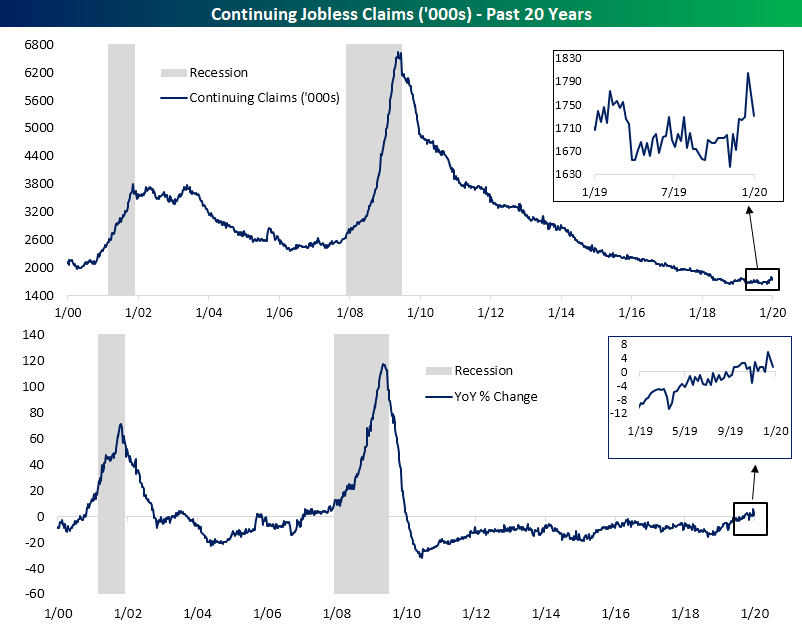
While initial jobless claims have improved in recent weeks, continuing claims have yet to fully share in the improvement. This week and last have changed that picture somewhat as continuing claims similarly were lower than forecasts, falling to 1,731K compared to the 1,750K expected reading. As shown in the charts below, just two weeks ago continuing claims totaled 1,804K which was the highest reading since April of 2018. Since then, though, they have started to fall back into last year’s range. Despite the improvement over the last few weeks, continuing claims have still been rising on a y/y basis for the first time this cycle. Start a two-week free trial to Bespoke Institutional to access our interactive economic indicators monitor and much more.
B.I.G. Tips – Maybe Next Year for Crude
Bespoke’s Morning Lineup – 1/23/20 – More Corona
See what’s driving market performance around the world in today’s Morning Lineup. Bespoke’s Morning Lineup is the best way to start your trading day. Read it now by starting a two-week free trial to Bespoke Premium. CLICK HERE to learn more and start your free trial.
The coronavirus is increasingly starting to show up around the world today, and authorities are taking additional steps to contain its spread. Travel has not only been restricted into and out of the city of Wuhan but has reportedly been expanded to other cities as well. Additionally, as we type this Singapore just announced its first confirmed case. Macau has even announced that all parties and festivities tied to the New Year celebration have been canceled, and the CEO of WYNN has said that they will not rule out closing its casinos on the island. Imagine if New York city just canceled the Times Square ball drop on New Year’s Eve? Even if the outbreak is contained, already it is having an economic impact.
Remember back in 2008 during the Financial Crisis when no one wanted to go home long on a Friday and risk a negative news event coming out over the weekend? Well, that’s the case in China now as the Shanghai Composite fell nearly 3% ahead of the week-long Lunar New Year holiday. With the coronavirus continuing to spread and no one knowing how the great migration in China during this holiday period will impact the spread, it is only natural that traders looked to lighten up in what will be their last chance to trade until next Friday.
While it’s only natural, today’s drop was the Shanghai Composite’s worst one-day decline on the last day of trading heading into the Lunar New Year holiday on record. While the last few days have been a downer for Chinese stocks, the uptrend from last summer’s lows remains intact, and if the steps being taken in China to contain the virus are successful, those sales will quickly turn into buys when traders come back next week from the holiday.

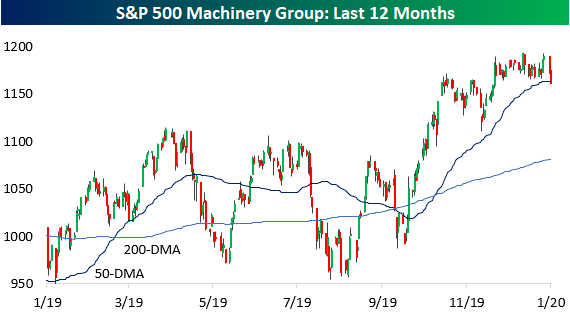
Machinery Stocks Stall Out
It was a generally disappointing day for equities as the major averages finished well off their highs of the day. One sector that looked to take today’s weakness rather hard was the Machinery group. After trading in a sideways range for well over a month, weakness in the group has picked up steam in the last two days and just today it closed below its 50-day moving average (DMA) for the first time in over three months.
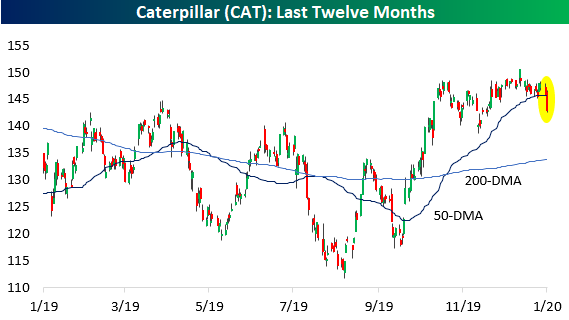
Three individual stocks in the group that also faltered today are also three of the larger stocks in the group, and we’ll take them alphabetically. First, Caterpillar (CAT) hasn’t been able to top the $150 level for quite some time and based on today’s trading, buyers look to have given up. The stock fell over 2.2% today for its worst day since October 1st. CAT reports earnings on 1/30, and if it doesn’t break $150 with that report, $130 may be the next stop.
Deere’s (DE) chart looks very similar to CAT, but its rally in the last three months hasn’t been nearly as steep. Like CAT and the broader machinery group, though, DE broke below its 50-DMA in today’s sell-off. DE doesn’t report earnings until late February, and the stock looks to have more meaningful support not far below current levels.

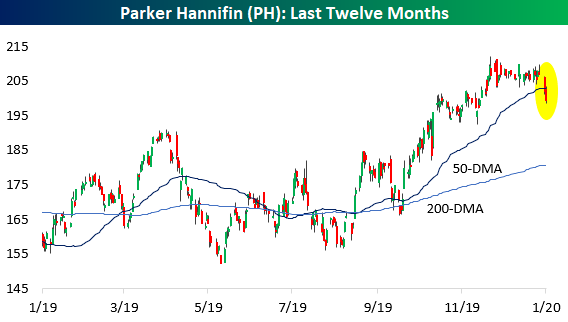
Lastly, Parker Hannifin’s (PH) chart looks more like CAT than DE, and like CAT, the stock was down nearly 2% today. PH has less support near current levels, and it also reports earnings on 1/30. Start a two-week free trial to Bespoke Institutional to access all of our research and interactive tools.
The Closer – Rates of Change, China Range, Diffusion Index, Home Sales Surge – 1/22/20
Log-in here if you’re a member with access to the Closer.
Looking for deeper insight on markets? In tonight’s Closer sent to Bespoke Institutional clients, we begin with a look at the Nasdaq’s gains through various rates of changes. We then look at the return of intraday volatility in Chinese equities. Turning to macroeconomic data, we review today’s Chicago Fed National Activity Index and existing home sales in addition to an update to our Economic Indicator Diffusion Index.
See today’s post-market Closer and everything else Bespoke publishes by starting a 14-day free trial to Bespoke Institutional today!