Sentiment Slides
Sentiment has come down over the past week according to survey data from AAII. The percentage of respondents reporting bullish sentiment fell over 10 percentage points this week down to 30.43%. That is the lowest level of bullish sentiment in the past few months but it could also be much lower, especially considering how much equities have fallen in the past week. As recently as October bullish sentiment was around 10 percentage points lower at 20.31%. Furthermore, while this brings it below the historical average for bullish sentiment (38.08%), from current levels it would need to fall roughly another 2.5 percentage points to be a more extreme 1 standard deviation below that average. Additionally, this past week’s drop was large, in the fourth percentile of all weekly changes of the past five year’s readings, but only a few weeks ago at the end of January we witnessed an even larger decline of 13.62 percentage points. Overall, while sentiment has come crashing down, it seems to be a bit more modest of a decline when compared to the rapid 8.75% drop in the S&P 500 since the results of the last survey.

As could be expected, the losses in bullish sentiment were picked up by the bearish camp this week as AAII’s reading on bearish sentiment rose from 28.7% to 39.13%. As with bullish sentiment, while that was a large increase in the 95th percentile of the past five year’s weekly changes, we saw an even larger rise of 12.09 percentage points just a few weeks ago at the end of January. This is the highest level bearish sentiment has been since October 10th when it had reached 43.96%.
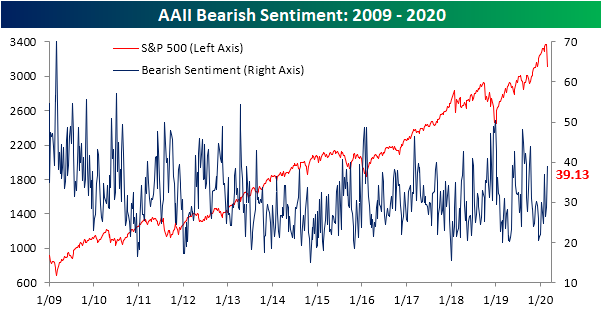
Neutral sentiment, on the other hand, was little changed this week at 30.43%. Rather than showing caution, investors seemed to have immediately gone from bullish to bearish in the past week. Start a two-week free trial to Bespoke Institutional to access our interactive economic indicators monitor and much more.

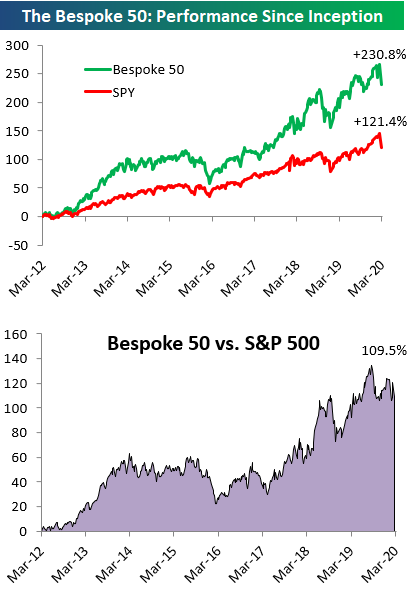
The Bespoke 50 Top Growth Stocks — 2/27/20
Every Thursday, Bespoke publishes its “Bespoke 50” list of top growth stocks in the Russell 3,000. Our “Bespoke 50” portfolio is made up of the 50 stocks that fit a proprietary growth screen that we created a number of years ago. Since inception in early 2012, the “Bespoke 50” has beaten the S&P 500 by 109.5 percentage points. Through today, the “Bespoke 50” is up 230.8% since inception versus the S&P 500’s gain of 121.4%. Always remember, though, that past performance is no guarantee of future returns. To view our “Bespoke 50” list of top growth stocks, please start a two-week free trial to either Bespoke Premium or Bespoke Institutional.
B.I.G. Tips – An Expanded Look at the 50-Day Moving Average Spread
Chart of the Day: Energy Spreads Blowing Out
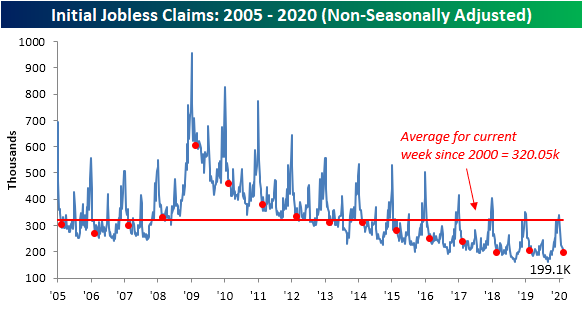
Claims on the Rise
Initial jobless claims rose this week, albeit at a slightly larger than expected rate (219K vs 212K estimate). Claims have now risen in back-to-back-to-back weeks for the first time since September after bottoming out at 203K which was the lowest print since last spring’s multi-decade lows. While claims are up, the fact that the magnitude of the increases has been small and that claims were coming off of already low levels, this week’s print only leaves us at similar levels to the second half of January.

As claims have moved slightly higher over the past few weeks, so too has the four-week moving average, rising 0.5K to 209.75K.

As we have mentioned in the past, although we have gotten close in recent weeks, initial jobless claims have yet to put in a new cycle low for some time now. As shown in the charts below, for both the seasonally adjusted number and moving average there has not been a new cycle low for 45 consecutive weeks. Those are the longest such streaks of the current expansion. As we have discussed in the past, this is more of a representation of the lack of improvements for claims rather than degradation in labor data, especially as the level of claims remains at fairly healthy levels.
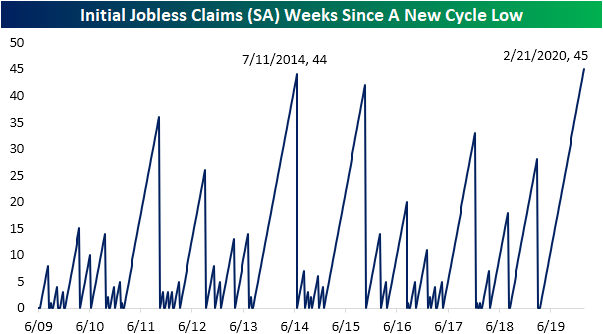
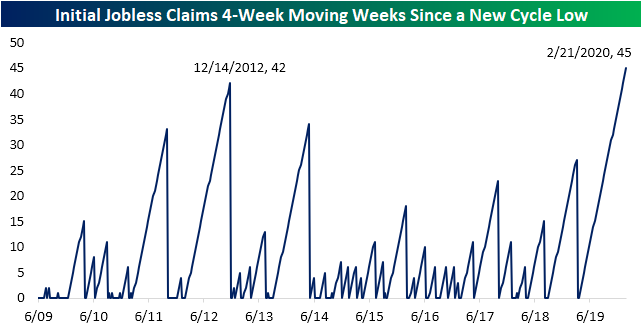
Turning to the non-seasonally adjusted number, claims have fallen again as is the norm for this time of year. Now at 199.1K, claims are well below their average for the current week of the year since 2000. While lower than last year, the comparable week in 2018 saw an even lower reading of 196.3K. Start a two-week free trial to Bespoke Institutional to access our interactive economic indicators monitor and much more.
Bespoke’s Morning Lineup – 2/27/20 – Heading For 10%
See what’s driving market performance around the world in today’s Morning Lineup. Bespoke’s Morning Lineup is the best way to start your trading day. Read it now by starting a two-week free trial to Bespoke Premium. CLICK HERE to learn more and start your free trial.
Equities still can’t find a floor as the newsflow on the spread of the coronavirus outside of China hasn’t shown any signs of improvement. What’s even more disconcerting is that the news headlines haven’t been all that bad yet either. Right now, it’s the fear of what could happen that’s driving the markets rather than what is actually happening. Meanwhile, just about every global equity market is trading lower right now, but China was actually up!
In economic data this morning, the only major outlier was a better than expected report on Durable Goods Orders. Jobless claims were higher than expected (219K vs 212K) but still not showing any early signs of stress in the labor markets.
Read today’s Bespoke Morning Lineup for a recap of the carnage in global equity markets overnight, the latest on the coronavirus, and a look at how the European economy was looking heading into the outbreak.

The S&P 500 is poised to open down another 1.5% this morning and that will bring the index ever so closer to reaching the 10% threshold for a correction. This current decline is already the steepest for the S&P 500 since the Q4 2018 near bear market, and if we reach the 10% threshold it will be the seventh such period since March 2009 where the S&P 500 dropped more than 10% from a bull market high. One notable aspect of this drop, though, is how fast it has happened which is very similar to the speed in which we dropped in early 2018 as well.

The Closer – Rally In Reverse, But For How Long? – 2/26/20
Log-in here if you’re a member with access to the Closer.
Looking for deeper insight on markets? In tonight’s Closer sent to Bespoke Institutional clients, we with a look at how the S&P 500’s intraday pattern has changed from the Q4 rally to now. We also show a decile analysis based upon the best and worst-performing stocks from October until before the current sell-off began. Next, we review put volumes before reviewing today’s EIA data and crude oil’s negative technicals. Turning to macroeconomic data, we review today’s new home sales.

See today’s post-market Closer and everything else Bespoke publishes by starting a 14-day free trial to Bespoke Institutional today!
Daily Sector Snapshot — 2/26/20
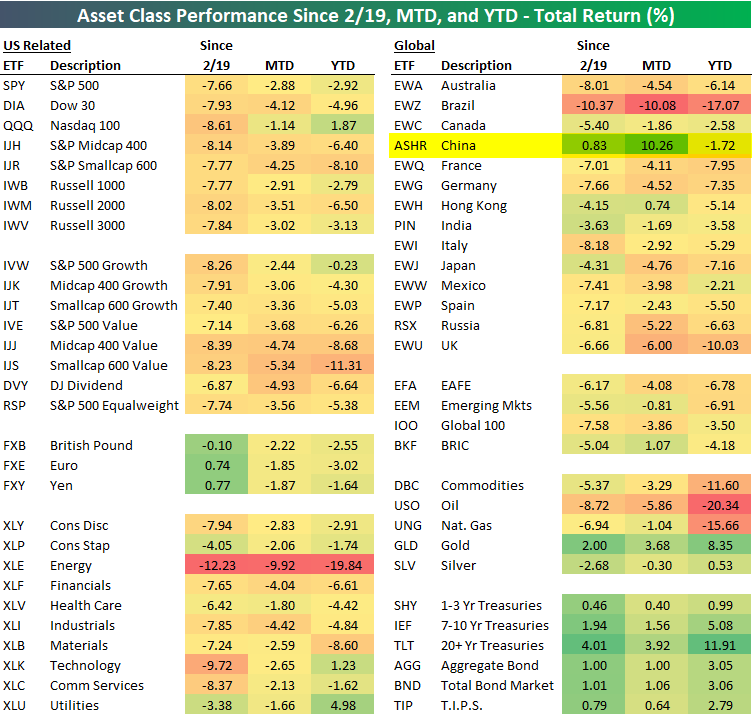
The Biggest Beneficiary of Coronavirus — Chinese Markets?
In our prior post we noted that the country whose stock market is the closest to its YTD highs is China — the country at the epicenter of the Covid-19 virus. We’ve got more stats in this regard.
Below is a look at our ETF performance matrix highlighting recent returns of asset classes around the world. While the US stock market is down 7-8% since February 19th when the S&P peaked, the China ASHR ETF is actually up 0.83% over the same time frame.
Your best bet to play the global fear trade this month has not been to buy the 20+ Year Treasury ETF (TLT) or something like Gold (GLD), which are both up more than 3%. No, the best trade for a US equity investor would have been to go all-in on the Chinese equity market ETF (ASHR). Join Bespoke Premium to access Bespoke’s most actionable stock market research and analysis. Start a two-week free trial now!
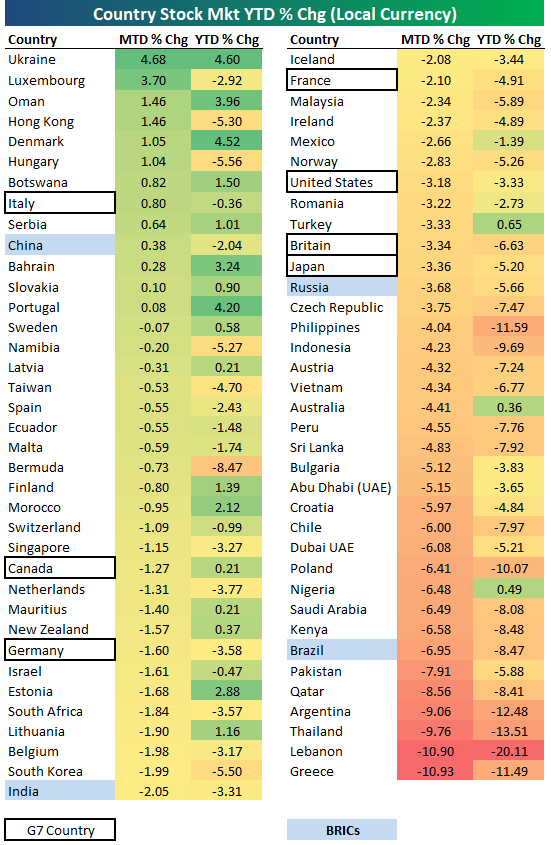
In terms of performance in local currency as opposed to performance in US dollars which is what our asset class matrix above shows, below is a look at month-to-date and year-to-date returns for the major equity indices of 73 countries around the world. As shown, even in local currency, China has easily been the best of the “BRICs” with a month-to-date gain of 0.38%.
And to boot, the country in the G7 where a worrisome coronavirus outbreak has occurred (contributing in large part to this week’s major sell-off) — Italy — is the only one that’s actually up month-to-date with a gain of 0.80%. All six other G7 countries are down more than 1% month-to-date.
Finally, below is a table that shows the percentage of total world equity market cap that the largest stock markets around the world make up. The country that has seen the biggest increase in its share of world equity market cap both year-to-date and month-to-date is — you guessed it — China. Up until this year, China had been seeing a decrease in its share of world market cap due to the trade war. But so far in 2020, China has managed to increase its share of world market cap from 8.44% up to 9.30%. So far in February — when corona fears really started to ramp up — China has increased its share of world market cap by 63 basis points, while the US has lost 6 basis points.
While you might not want to physically be in China right now, from an investment standpoint, there has been no better place in the world for a US investor to put their money.

Global Equity Benchmarks Distance From YTD Highs
The recent equity sell-off has clearly been global in nature as concerns of a global pandemic rise. Perhaps the most surprising aspect of the way equities have sold off recently is that the country that has been hardest hit by the virus is closer to its YTD high than any other major global equity benchmark. The chart below shows the distance that each major global equity benchmark has declined relative to its YTD high. China’s Shanghai Composite is down just 4.45%, which is better than any other country shown. Sure, you could argue that the Chinese government is manipulating the market and prohibiting investors from selling, but even the ETF that tracks the CSI 300 (ASHR) is down less than 6%, so anyone could go in and trade at these levels. Manipulated or not, the numbers are the numbers.
At the bottom of the list, Brazil’s Ibovespa index is down more than any other country at 11.6% and that country has only reported one confirmed case so far. With respect to US indices, the Russell 2000 is down the second most of any major global benchmark (-9.19%), while the Nasdaq is down the fourth most at 8.68%. Even the S&P 500 is down close to 8%. These weak US readings come in a backdrop where there have only been 57 confirmed cases and all but a couple are instances where Americans contracted the virus outside of the United States and have been brought to the US under quarantine. Join Bespoke Premium to access Bespoke’s most actionable stock market research and analysis. Start a two-week free trial now!
