The Closer: End of Week Charts — 6/28/19
Looking for deeper insight on global markets and economics? In tonight’s Closer sent to Bespoke clients, we recap weekly price action in major asset classes, update economic surprise index data for major economies, chart the weekly Commitment of Traders report from the CFTC, and provide our normal nightly update on ETF performance, volume and price movers, and the Bespoke Market Timing Model. We also take a look at the trend in various developed market FX markets.
The Closer is one of our most popular reports, and you can sign up for a free trial below to see it!
See tonight’s Closer by starting a two-week free trial to Bespoke Institutional now!
Next Week’s Economic Indicators – 6/28/19
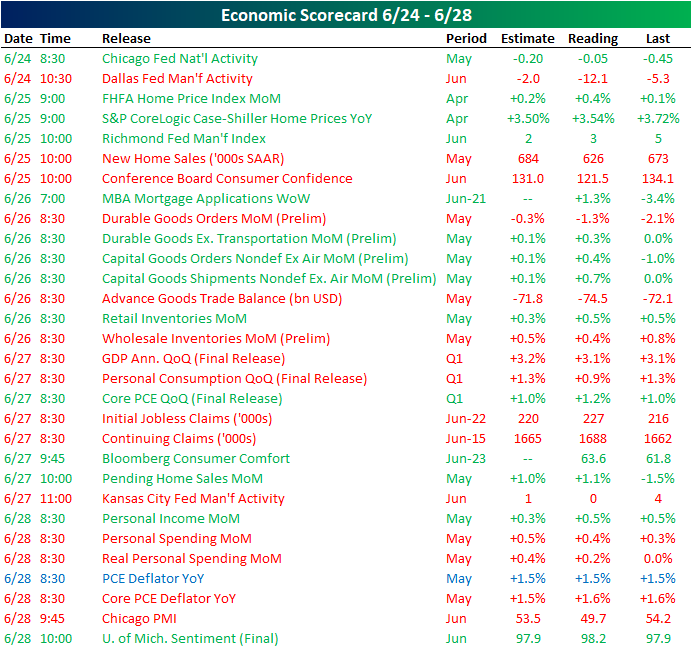
In posts yesterday and Monday, we made note of the increasingly disappointing economic data out of the US relative to expectations so far in 2019. This week’s data only added to the woes as the Citi Economic Surprise Index for the US now sits only 0.73% above its April low.
Over half of this week’s releases came in worse than the prior period of estimates. The Chicago Fed’s National Activity Index was the first release this week showing improvements from the April data and coming in above estimates, but the indicator is still showing contracting activity (reading below zero). The Dallas Fed’s Manufacturing Activity index also was out on Monday showing far weaker results. Later in the week, on Thursday, the Kansas City Fed released their own manufacturing activity index completing our Five Fed Composite which is painting a bleak picture for the manufacturing sector. There was also a good amount of housing data this week with overall solid results including stronger than expected home prices (via the FHFA index and S&P CoreLogic’s Case-Shiller Index) but disappointing new home sales on Tuesday, improved MBA Mortgage Applications on Wednesday, and a much better Pending Home Sales print on Thursday. Chicago PMI dropped below 50 on Friday, which is a sign of contraction, but Michigan Confidence beat estimates. One other major release this week was the third and final release of quarterly GDP, which held steady at 3.1% QoQ but was below estimates of an increase to 3.2%.
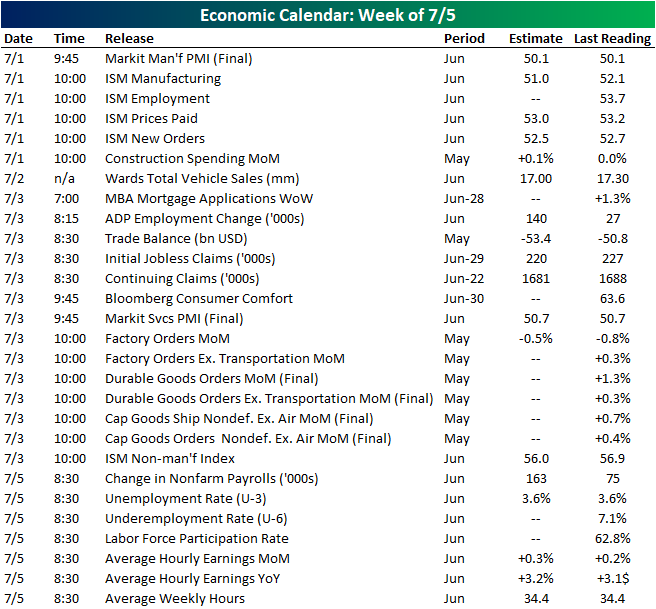
Despite a shortened week due to the July 4th holiday, next week is set up to be a busy one. On Monday, Markit will release their final June PMI on manufacturing alongside the ISM reading later that morning. While Markit measures on manufacturing are expected to hold steady at 50.1, ISM data is anticipated to fall 1.1 down to 51. The only release Tuesday will be data on vehicle sales, which are expected to fall to 17 mm SAAR. On Thursday, there will be no releases and US markets will be shuttered in observance of the July 4th holiday. Additionally, markets will close early (1:00 PM EST) on Wednesday. In spite of this shortened session and day off, there is a huge slug of data to be released Wednesday. Following up the manufacturing PMIs, Markit and ISM non-manufacturing indicators are all due out on Wednesday. In the late morning, final May data on Factory, Durable, and Capital Goods Orders are also going to be released. Alongside the standard Wednesday release of MBA Mortgage Applications, other weekly data that is typically released on Thursday will be pushed ahead one day including Initial Jobless Claims and Bloomberg Consumer Comfort. ADP employment numbers are expected to show improvements when it releases on Wednesday ahead of Friday’s Nonfarm payrolls report, which is also forecasting a solid improvement from the previous month. Start a two-week free trial to Bespoke Institutional to access our interactive economic indicators monitor and much more.
July 4th Market Returns
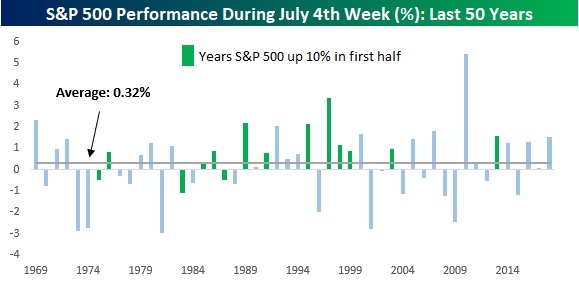
With the first half winding down to a close, Summer is in full swing as July 4th quickly approaches. While the days leading up to or after July 4th are usually on the quiet side with many people taking vacations, for the stock market, it is usually a relatively positive week. The chart below shows the S&P 500’s performance during the July 4th week measuring performance from the Friday before July 4th until the Friday after. In years where July 4th falls on a Friday or Saturday, we measure the S&P 500’s performance in the week leading up to July 4th.
For the July 4th week, going back to 1969, the S&P 500 has seen an average gain of 0.32% with positive returns 60% of the time. In the charts below, we have also included green shading in years where the S&P 500 was up 10%+ in the first half (as it is this year). In those years, returns during the July 4th week have been much better with an average gain of 0.93% and positive returns 79% of the time. In fact, the last time the S&P 500 was down during the July 4th week in a year where the S&P 500 was up 10%+ in the first half was in 1986!
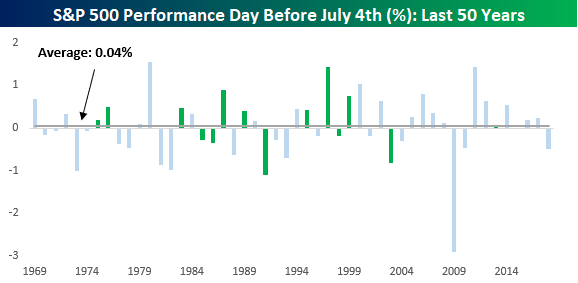
Similar to the July 4th week, the day before July 4th has also historically been positive but not nearly to the same degree. On those days, the S&P 500 has averaged a gain of 0.04% with positive returns only slightly more than half of the time (54%). In years where the S&P 500 was up over 10% in the first half, the day before July 4th is considerably better, averaging a gain of 0.17% with gains 64% of the time.
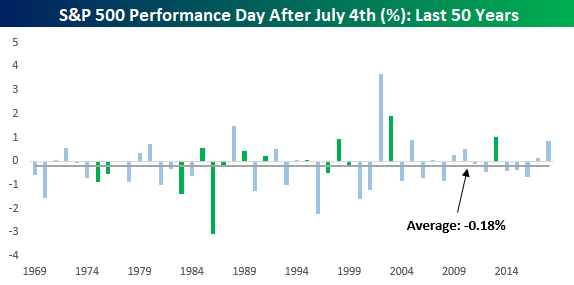
With people out celebrating the July 4th holiday, the hangover sets in after. As shown below, the average S&P 500 change on the trading day after July 4th is a decline of 0.18% with gains only 42% of the time. In years when the S&P 500 was up over 10% in the first half, the declines aren’t as bad, but at -0.12% and gains only half of the time, they aren’t positive either. This year the day after July 4th will also feature the June Non-Farm Payrolls report. That will be fun! Start a two-week free trial to Bespoke Institutional to access our Seasonality Database and much more.
Bespoke Market Calendar — July 2019
Please click the image below to view our July 2019 market calendar. This calendar includes the S&P 500’s average percentage change and average intraday chart pattern for each trading day during the upcoming month. It also includes market holidays and options expiration dates plus the dates of key economic indicator releases. Start a two-week free trial to one of Bespoke’s three premium research levels.
B.I.G. Tips – July 2019 Seasonality
Trend Analyzer – 6/28/19 – Teetering On Overbought
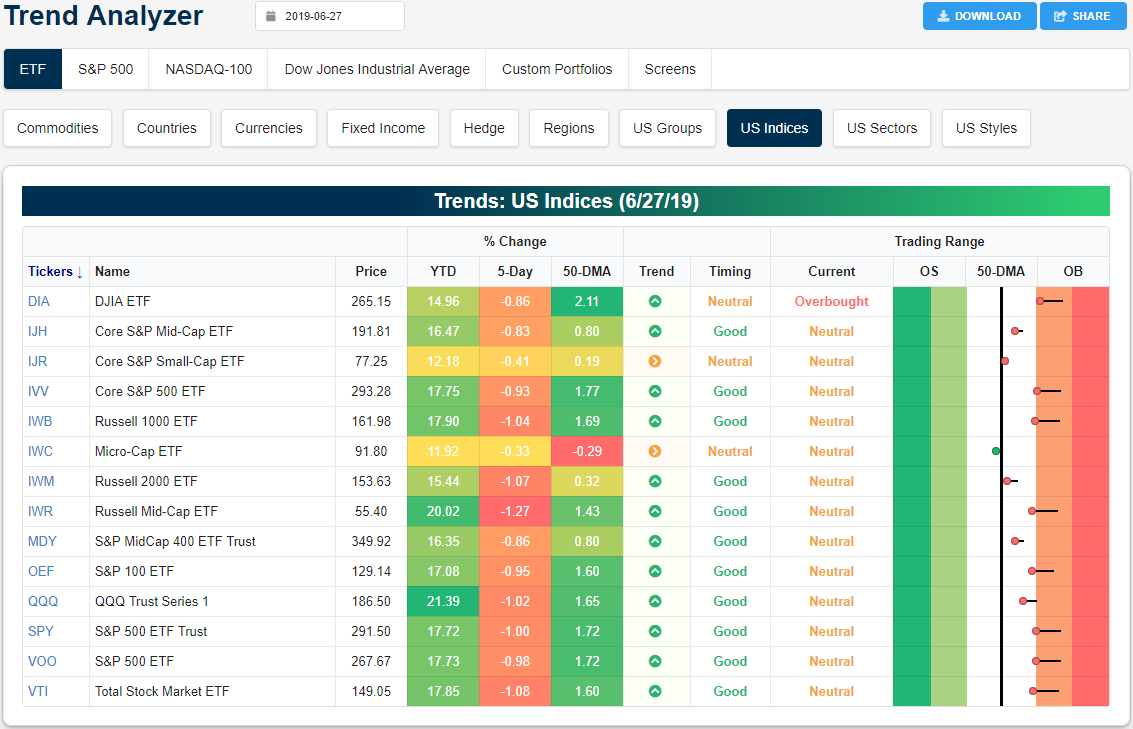
After the S&P 500 (SPY) set a new all-time high last Thursday, stocks have yet to make a push back above these levels as all of the major index ETFs sit below where they were at last Thursday’s close. This pullback was partially a function of the large-cap major index ETFs like the Russell 1000 (IWB) working off overbought levels. Whereas all of these were overbought last week, currently only the Dow (DIA) still sits in overbought territory although other large caps are teetering on joining DIA. The Core S&P Small Cap (IJR) and Micro Cap (IWC) are only lower by 0.41% and 0.33%, respectively. These are smaller losses compared to other ETFs which lost around 1%. Ironically, this outperformance also comes as IJR and IWC are now showing sideways trends rather uptrends across the rest of the ETFs. Granted, not all small-cap indices have been outperforming. Another small-cap index, the Russell 2000 (IWM), has seen performance more inline with other ETFs, declining 1.07%.
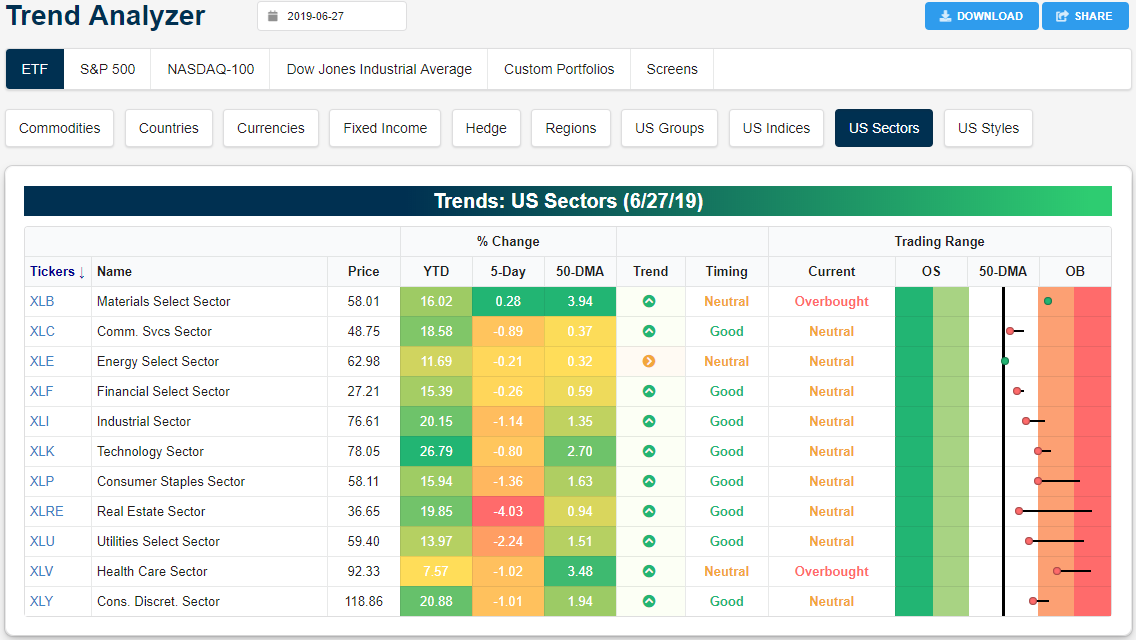
Every sector except Materials (XLB) is lower over the last week. As shown in our Trend Analyzer snapshot below, it’s the defensives that are finally lagging, with Real Estate (XLRE) down 4% and Utilities (XLU) down 2% since last Thursday’s close. At the moment, only Materials and Health Care are overbought, while the rest are neutral. Start a two-week free trial to Bespoke Institutional to access our Trend Analyzer and much more.
Morning Lineup – Partying Like it’s 1995
Why party like it’s 1999, when you can party like it’s 1995 instead? With futures indicated higher on the day, the S&P 500 is on pace to finish the first half with a gain of over 18%, while long-term US Treasuries are flirting with a gain of over 10% on the year. Heading into the last trading day of the half, the major focus is obviously on the weekend meeting between President Trump and President XI. Expectations are low heading into the meeting, but we should have a better idea of how things are going to play out as the day goes on and into tomorrow. To bad Xi doesn’t have a Twitter account too!
While China trade talks are a major issue, there is also a decent amount of economic data to contend with today and into next week. Then, after the July 4th weekend, we’ll start to kick off second-quarter earnings season.
Read today’s Morning Lineup to get caught up on everything you need to know ahead of the new trading day including a recap of overnight trading in Asia and Europe as well as a rundown of all economic data released.
Bespoke Morning Lineup – 6/28/19
As mentioned above, 2019 is on pace to be the first year since 1995 where both long-term Treasuries (as measured by the Merrill Lynch Long-Term Treasuries Total Return Index) and the S&P 500 were up more than 10% in the first half of the year. Going back to 1978, this is also only the fifth year where both saw double-digit gains in the first half.
In the table below, we highlight each of those five years and show the performance of both asset classes in Q3. In the case of both asset classes, Q3 saw middling returns with periods of positive and negative returns evenly split.
Start a two-week free trial to Bespoke Premium to see today’s full Morning Lineup report. You’ll receive it in your inbox each morning an hour before the open to get your trading day started.
The Closer – Bond Divergence, Ford Flopping, Comfort Climbing, Five Fed Flop – 6/27/19
Log-in here if you’re a member with access to the Closer.
Looking for deeper insight on markets? In tonight’s Closer sent to Bespoke Institutional clients, we kick things off with a look at some bearish technical divergences in interest rate markets as well as a look at Ford (F) given the announcement of a reorganization of the company’s European activities. We then look at Bloomberg’s Consumer Comfort Index which came in at the highest level in 20 years. We finish with a final look at our Five Fed Manufacturing Composite for June with the release of the Kansas City Fed’s Activity index.

See today’s post-market Closer and everything else Bespoke publishes by starting a 14-day free trial to Bespoke Institutional today!
Bespoke’s Sector Snapshot — 6/27/19
The Bespoke 50 Top Growth Stocks
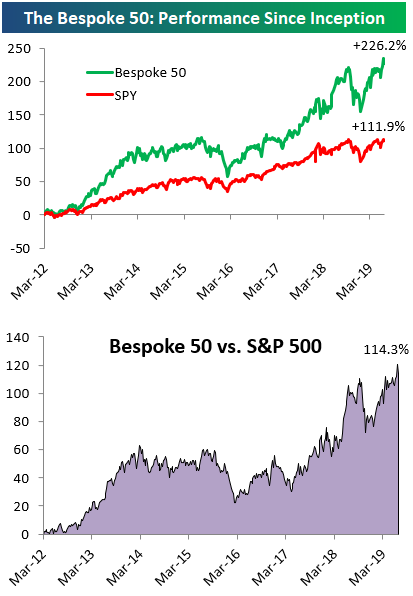
Every Thursday, Bespoke publishes its “Bespoke 50” list of top growth stocks in the Russell 3,000. Our “Bespoke 50” portfolio is made up of the 50 stocks that fit a proprietary growth screen that we created a number of years ago. Since inception in early 2012, the “Bespoke 50” has beaten the S&P 500 by 114.3 percentage points. Through today, the “Bespoke 50” is up 226.2% since inception versus the S&P 500’s gain of 111.9%. Always remember, though, that past performance is no guarantee of future returns.
To view our “Bespoke 50” list of top growth stocks, please start a two-week free trial to either Bespoke Premium or Bespoke Institutional.

