Chart of the Day: Playing an APAC Recovery
Bespoke Stock Scores — 3/10/20
Bespoke’s Morning Lineup – 3/10/20 – Turnaround (For Now)
See what’s driving market performance around the world in today’s Morning Lineup. Bespoke’s Morning Lineup is the best way to start your trading day. Read it now by starting a two-week free trial to Bespoke Premium. CLICK HERE to learn more and start your free trial.
After starting the day limit down yesterday, futures were briefly limit up today but have pulled back a bit. Besides the deeply oversold readings in equities, a catalyst for the surge is the Administration’s promised “very dramatic” actions last night. The White House plans being floated by the President last night include a payroll tax cut and short-term expansion of paid sick leave. Full details are due later today.
For now, markets will continue to trade off fear and headlines, so expect more of the same in terms of volatility.
Read today’s Bespoke Morning Lineup for a discussion of the moves overnight and this morning, the latest updated figures on the coronavirus, and a recap of Asian and European markets.

Below is an update of our S&P 500 sectors and where they are trading relative to their trading ranges. Every sector is currently oversold, and the only sector that isn’t at ‘extreme’ levels is Utilities. Along with Utilities, the only two sectors not more than 3-standard deviations below their 50-DMA are Consumer Staples and Health Care.

The Closer – Manic Mondays – 3/9/20
Log-in here if you’re a member with access to the Closer.
Looking for deeper insight on markets? In tonight’s Closer sent to Bespoke Institutional clients, we recap today’s historic session in which the S&P 500 fell by its largest amount since the financial crisis. We show what stocks drove these declines before evaluating claims that low oil prices will be a good thing for the economy. We finish by looking at what weakness in energy means for credit markets.

See today’s post-market Closer and everything else Bespoke publishes by starting a 14-day free trial to Bespoke Institutional today!
Daily Sector Snapshot — 3/9/20
A Day for the Decade
There have been bigger declines in the equity market throughout history, but not many. In fact, for the S&P 500 and many sectors, larger one-day declines haven’t been seen in at least a decade. The S&P 500 fell more than 7.5%, which was the largest one-day decline for the index since 12/1/08. After today’s drop, the US equity benchmark is down to its lowest level since June 3rd of last year.
In terms of individual sectors, ground zero for the market was the Energy sector. Going back to 1989 when daily data begins, today’s 20.1% decline was the largest one-day drop on record, and the index is now at its lowest level since August 2004. That’s not a typo! The only other sector that was down more than 10% today was Financials, which saw its largest one-day decline since 4/20/09 and is at its lowest level since Christmas Eve 2018. Industrials was another hard-hit sector today, and while it was down less than 10%, the 9.2% drop was still the largest one-day fall since at least 1989 and took the index to its lowest level since January 2019. Start a two-week free trial to Bespoke Institutional for full access to our research and interactive tools.


Chart of the Day: Major Market Drops
Wondering What Could Have Been
With major US averages down over 6% today and a US economic recession appearing all but certain, last week’s strong employment report for February was written off before it was even released. The employment report wasn’t the only strong economic data point that we have seen in recent weeks but was part of a bigger trend of improved economic data. Take the Citi Economic Surprise index for the United States. Ever since last December, the index has seen a sharp turn higher and in just the last several trading days broke out to its best levels since the end of 2017. Of course, all of this data is stale: it doesn’t account for the large shock to aggregate demand which is currently unfolding or is likely about to unfold via the Covid-19 virus and measures necessary to stop it. Some countries have already felt the pain: China was able to stop rapid spread of the virus by shuttering its economy almost entirely, while the Lombardy region of Italy has seen massive restrictions on travel, public gatherings, and other forms of economic activity too. Any kind of similar restrictions on US activity or even voluntary measures undertaken by individuals would make the post-crisis norm of 2% real growth a pipe dream for the middle of 2020.

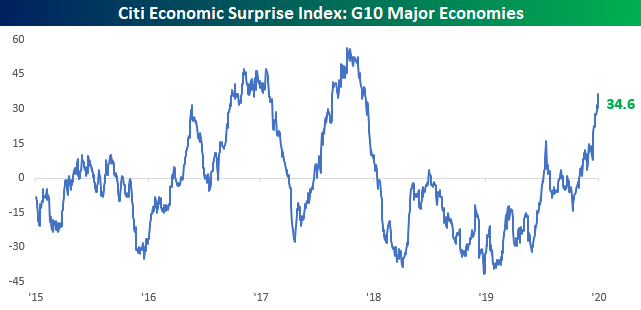
The impact of reduced activity won’t show up in data for a couple of weeks, but it’s almost certain to drive down activity relative to expectations. It’s a shame, too: prior to Covid-19, the global economy looks to have turned a
corner and was accelerating sharply for the start of 2020 after Fed easing last year. The G10 major economy economic surprise index was at the highest level since the synchronized uplift in global growth which buoyed activity in 2017 as-of this morning, but thousands of Covid-19 cases across Western Europe and the rest of the world have completely flipped the global economy. For investors and economies alike, the data suggests that optimism from the start of the year would have been correct if not for the brutal impact of the coronavirus across the world over the last two months. Start a two-week free trial to Bespoke Institutional for full access to our research and interactive tools.
Country Stock Market Declines and YTD Change
As shown in the table below, the average decline from 52-week highs across 72 country stock markets now stands at -19.08% (in local currency). The decline in the US is now 17% from its 52-week high, which puts it in the better half in terms of price drop. Greece has fallen the most from its 52-week high at -37.52%, followed by Lebanon (-36.09%), Saudi Arabia (-32.84%), and Poland (-32.63%). Italy’s drop of 26.53% from its 52-week high makes it the worst performing G7 country, while Brazil has been the worst-performing BRIC country with a drop of 25.66%.
At the other end of the spectrum, China’s stock market is down 10.5% from its 52-week high, which makes it the best performing of any G7 or BRIC country. Start a two-week free trial to Bespoke Institutional for full access to our research and interactive tools.

Bespoke’s Morning Lineup – 3/9/20 – Saudis Go Scorched Earth
See what’s driving market performance around the world in today’s Morning Lineup. Bespoke’s Morning Lineup is the best way to start your trading day. Read it now by starting a two-week free trial to Bespoke Premium. CLICK HERE to learn more and start your free trial.
Sometimes, there’s not much you can say. US equity futures are trading limit down right now, but the S&P 500 ETF (SPY) is currently down 6.9%, which is a tenth of a percent from tripping the first 15-minute circuit breaker. As global concerns over the coronavirus weren’t damaging enough to economic activity, this weekend’s move by the Saudis to slash oil prices added just another boot on the neck of the economy. Moves that we are seeing right now in equities and other financial assets don’t come around very often, and while they are the result of developing economic conditions and uncertainty, the moves themselves will ultimately also have their own economic impacts.
Read today’s Bespoke Morning Lineup for a discussion of the moves overnight, the latest updated figures on the coronavirus, the Saudis scorched earth policy regarding oil prices, and how this will all impact the economy.
The price chart of Europe’s STOXX 600 is really something to behold. Less than a month after hitting 52-week highs, the index is now knocking on the door of 52-week lows. It’s rare enough to see this type of a reversal in an individual stock, but for a benchmark equity index of an entire continent, it’s nuts. With a decline of over 3% today, the STOXX 600 is now less than 2% from hitting that level. As we discussed in the Morning Lineup, this is just a further illustration of how before the coronavirus breakout started, the global economy was starting to accelerate.
