Stocks for the COVID Economy — 6/2/20
Chart of the Day: Nasdaq’s Epic Rally
B.I.G. Tips – Five Months Until Election Day
May 2020 Headlines
Bespoke Stock Scores — 6/2/20
Hard to Find A Stock Below Its 50-Day
In today’s Morning Lineup, we noted that 100% of S&P 500 Industry Groups are now above their 50-DMAs. But individual stocks have been equally as impressive in regards to their 50-DMAs. As of yesterday’s close, 96.24% of S&P 500 stocks finished the day above their 50-DMAs. Including yesterday, there have only been five days since 1990 that has seen as strong if not stronger readings. All of those occurred in mid-February and early March of 1991. So it has been quite some time since the S&P 500 last had this many stocks trading above their 50-days.
Given the strong reading for the broader index, for the first time since March of 2016, there are four sectors with 100% of their stocks above their 50-DMAs: Communication Services, Energy, Industrials, and Materials. Consumer Discretionary is also close at 98.41%. Every other sector has at least 90% of their stocks above except for Utilities. Granted, it is by no means weak or far behind the rest of the pack with a reading of 89.29%.

The charts below from our Daily Sector Snapshot show the percentage of stocks above their 50-DMAs by sector over the last year. For the sectors with 100% of their stocks currently above their 50-DMAs, it has understandably been a while since the last time they read 100%. For Communication Services, the current string of days with 100% of stocks above their 50-DMAs has been the first since September of 2018. For Energy and Industrials, this has been the first time since February of 2019 and for the Materials sector, the last time that 100% of stocks were above their 50-days was July of last year. Start a two-week free trial to Bespoke Institutional to access our interactive economic indicators monitor and much more.

High Yield Credit Rally Really Rolling
While the US equity rally has been more “slow and steady” than “big and bold” in the last couple of weeks, credit markets have been flying. In the chart below we show the spreads on CDX HY, the index of high yield credit default swaps used as a reference for junk bond markets. As shown, the back half of May has been a very good period for high yield investors as spreads have run almost 200 bps tighter. They’re now at the tightest levels since the March blow-out in spreads as US equities plunged into the fastest bear market since the Depression. We covered high yield spreads in more detail in last night’s Closer report, which is available to Bespoke Institutional members. Click here to start a two-week free trial.

Bespoke’s Morning Lineup – 6/2/20 – What, Me Worry?
See what’s driving market performance around the world in today’s Morning Lineup. Bespoke’s Morning Lineup is the best way to start your trading day. Read it now by starting a two-week free trial to Bespoke Premium. CLICK HERE to learn more and start your free trial.
t’s hard to say there was much in the way of good news. Civil unrest continued to rage in cities across the US overnight, although the magnitude of looting and violence that accompanied some of the peaceful protests didn’t appear to be as severe. Despite the negative headlines, though, US futures are indicated higher again and on pace for the 6th positive day in the last seven.
Be sure to check out today’s Morning Lineup for a rundown of the latest stock-specific news of note, the civil unrest in the US, news in global markets, global and national trends related to the COVID-19 outbreak, and much more.

We’re starting to run out of ways to show how strong breadth has been in recent weeks and how much of an about-face we have seen in the last 50 trading days, but this morning we’ll give you one more. First, the percentage of S&P 500 Industry Groups currently above their 50-day moving averages currently sits at 100%. You can’t get any higher than that! Second, not only is every S&P 500 Industry Group above its 50-DMA, but all of their 50-DMA are also rising as well. Both of these readings were 0% less than three months ago!


Daily Sector Snapshot — 6/1/20
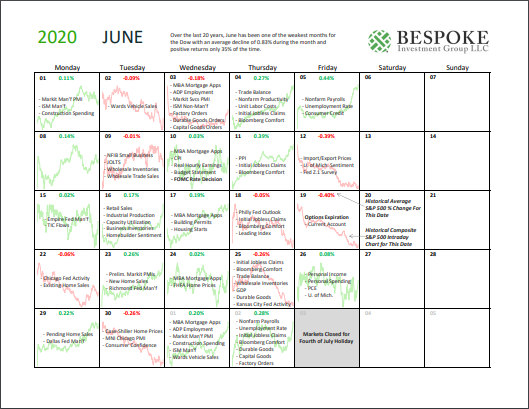
Bespoke Market Calendar — June 2020
Please click the image below to view our June 2020 market calendar. This calendar includes the S&P 500’s average percentage change and average intraday chart pattern for each trading day during the upcoming month. It also includes market holidays and options expiration dates plus the dates of key economic indicator releases. Start a two-week free trial to one of Bespoke’s three research levels.