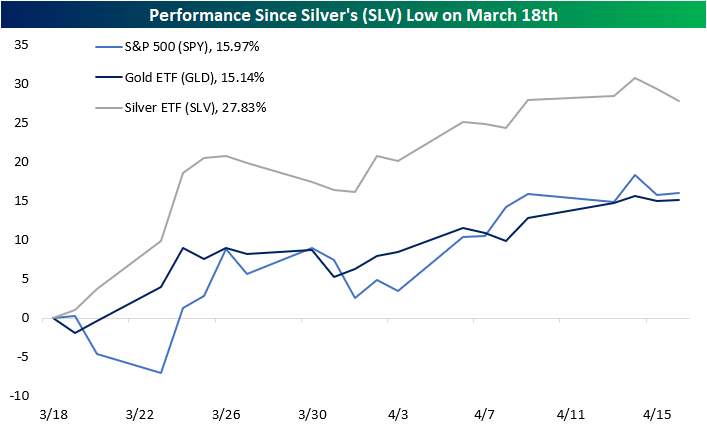
Silver Shining in the Near Term, Gold Shining Over the Long Term
Gold (GLD) has had an interesting run over the past year. Last spring, the ETF for the yellow metal finally pressed above multiyear resistance roughly around $130. After surging through late summer, GLD continued its rally at the end of 2019 and early 2020 before turning sharply lower alongside stocks in March. But since its March 19th low it has gone on to rally over 17% as of today and is now at its highest levels since early 2013.

Another precious metal, Silver (SLV), has not been as fortunate. Although it shared in the rally last spring and summer, SLV has yet to eclipse its early September highs. While gold had broken out again in February and March, silver put in a lower high before plummeting to its lost level since 2009 in mid-March.

But since that low on March 18th, SLV has actually outperformed rising 27.83%. Gold is up only up 15.14% since that same day and 17% since its respective low one day later on March 19th. While the S&P 500’s (SPY) low was not put in place until a few days after gold and silver on March 23rd, since March 18th, SLV is also outperforming SPY’s 15.97% gain.
Over the long term, though SLV is still the worst performer of the group. As shown in the chart below, SLV is down 8.84% over the past two years while the S&P 500’s gains have also been somewhat lackluster thanks to the most recent sell-off with only a 4.11% gain. Gold, on the other hand, has outshined the other two having surged 26.93%. Start a two-week free trial to Bespoke Institutional to access our full range of research and interactive tools.
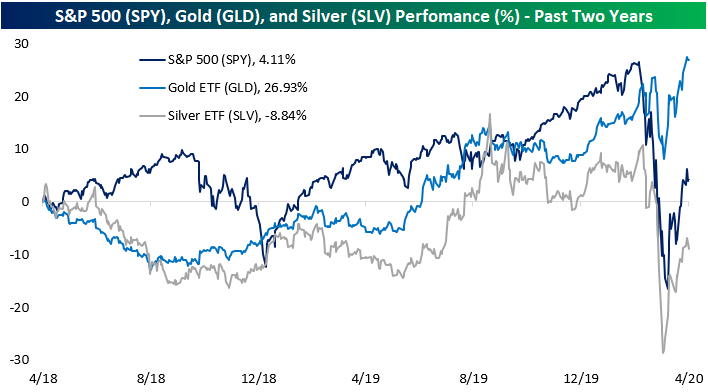
Chart of the Day: How Have Earnings Estimates Changed?
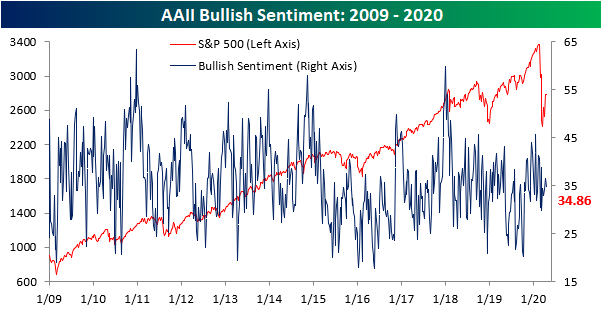
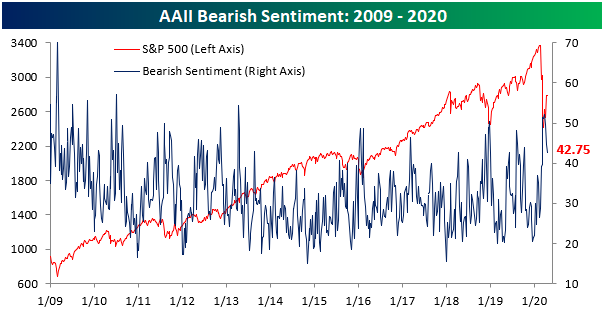
Waning Bullish Sentiment
The equity market’s rally off of the bear market low on March 23rd has taken pause with the S&P 500 more or less flat over the past week. With a lack of a push higher, optimistic sentiment has waned. The American Association of Individual Investors‘ weekly sentiment survey saw 34.86% of respondents reporting as bullish this week. That is down 1.7 percentage points from last week.
That is not to say those investors have turned into pessimists though. Bearish sentiment is also down this week, falling to 42.75% from 44.7% last week. Bearish sentiment is now at its lowest level since the first week of March. Granted, it is still the predominant sentiment and is very elevated at over one standard deviation above its historical average of 30.42%.
With fewer investors taking a bullish or bearish stance, an increased share are reporting neutral sentiment which is now at 22.39%. Neutral sentiment has been very muted recently with this week marking the first time since the first week of March that more than 20% of investors are reporting as neutral.

Despite their moves this week, bearish sentiment remains elevated while neutral sentiment remains stretched to the downside. It has now been six straight weeks in which bearish sentiment has been extremely elevated (over 1 standard deviation above its historical average) while neutral sentiment is extremely muted (over 1 standard deviation below its historical average). That is now tied with another six week long streak ending in September of 2007 for the longest such streak in the history of the survey. In other words, although things have improved a bit in the past couple of weeks, investors have been decidedly bearish by this measure for a historically long stretch of time.
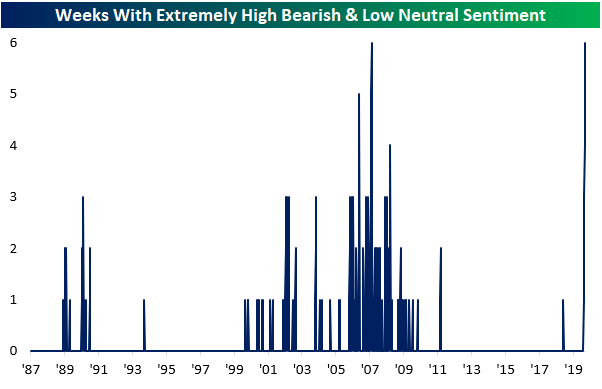
The bull-bear spread echoes this as this week marked the eighth consecutive week in which the spread has favored bears. As shown in the table below, that is far from the longest streak in the survey’s history, one that ran for 22 weeks in 1990 holds the record, but it is significantly longer than most others. The current streak is the longest since another one that ended at eight weeks long in February of 2016. Start a two-week free trial to Bespoke Institutional to access our interactive economic indicators monitor and much more.

Philly Fed Collapses
Yesterday, we highlighted the collapse of the first of the April regional Federal Reserve indices which was from the New York Fed. This morning, we got an update from the Philadelphia Fed, and the results were not much better. The headline index fell from -12.7 in March to -56.6 in April. That is the second-lowest level of the index on record behind the record low of -57.1 back in July of 1980. That deterioration has come very rapidly. As recently as February, before COVID-19’s impact had been fully felt, the index was at 36.7 which is at the upper end of its historic range in the 97th percentile of all readings. In just the last two months, though, the headline index has experienced its two largest declines on record: -43.9 this month and -49.4 last month.

The components of the index are similarly at or near record lows. As shown in the table below, indices for demand and employment all experienced their largest declines ever this month. Overall, demand is weaker while delivery times are longer as both prices paid and received fall.
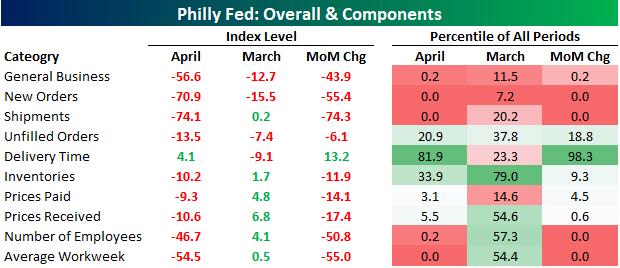
Demand is one of the key areas of weakness in the regional Fed reports. The indices for New Orders and Shipments have both fallen by their largest amounts ever to record lows.

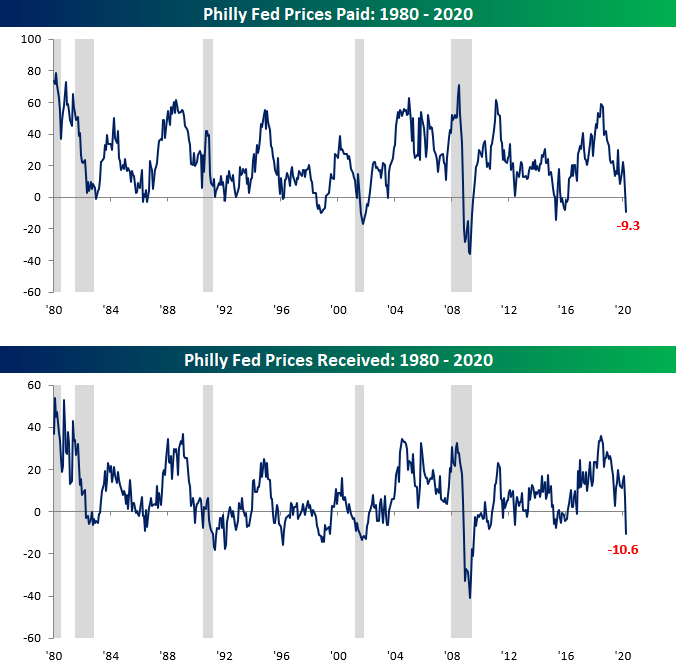
As a result of weak demand, prices are beginning to fall. The Prices Paid component is now down to -9.3 which is its lowest level since May 2015. Prices Received, on the other hand, is even lower at -10.6, which is the worst reading since July of 2009. The 17.4 point decline this month was also the fourth largest month over month decline for Prices Received on record.
Last month’s report had yet to capture the massive drop in employment as a result of COVID-19. That changed this month with the index for Number of Employees cratering to -46.7. That is the second-lowest reading ever behind March of 2009 when it fell to -51.5. Meanwhile, Average Workweek is down to its lowest level ever at -54.5. Start a two-week free trial to Bespoke Institutional to access our interactive economic indicators monitor and much more.

It’s Earnings Season (Or Whatever it is Companies Plan to Report)
It’s that time of year again. The time when corporate America reports financial results for the prior three months. Normally, we call it earnings season, but given the fact that most of the US economy has been shut down and no timetable is set for when it re-opens, for a lot of companies out there, there really isn’t much in the way of earnings, revenues, or guidance to speak of. Instead, this reporting period will likely be a lot of companies trying to put the best spin on how much (or little) cash they have on hand to withstand the shutdown.
Besides the major banks and financials, there hasn’t been a whole lot in the way of reports to speak of, but of the results we have seen, the stock market reaction hasn’t been great as companies like Johnson & Johnson (JNJ), JP Morgan (JPM), Wells Fargo (WFC), Bank of America (BAC), and Goldman Sachs (GS) have all seen negative reactions to their reports. The only large-cap that has really reacted positively to earnings so far is UnitedHealth (UNH) which gained more than 4%. Next week, the pace of reports will pick up, but the peak period for reports won’t be for another two weeks when more than 300 companies will report in a single day.
Our quarterly preview of earnings season is extremely useful and a must-read. To see the report, sign up for a monthly Bespoke Premium membership now!

Jobless Claims Still Dismal
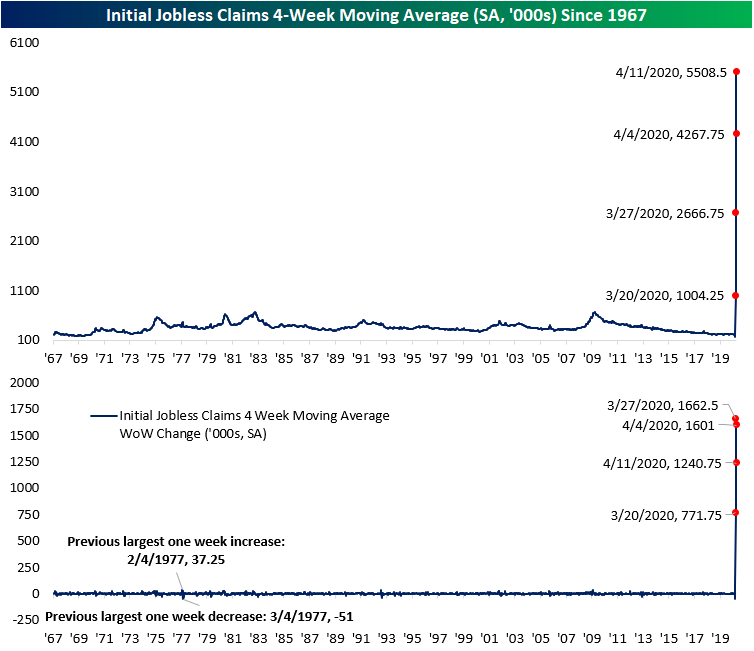
The pain has not stopped for the US labor market. Initial jobless claims remain at extremely elevated levels coming in at 5.245 million this week. Although this is still extremely high compared to other readings throughout history, this week’s print was a small improvement from the past few weeks coming in below expectations (5.625 million) as well as the past couple of weeks’ readings which have been well above 6.5 million. Last week, seasonally adjusted claims totaled 6.615 million which makes the 1.37 million drop to 5.245 million this week the largest single week decline on record. Obviously, that is little consolation given the fact that it was still the third-largest weekly reading on record. Put differently, although there were not as many added this week as the past few weeks, there are still a historically massive number of jobless claims being filed.

Over the past four weeks, there have now been over 20 million jobless claims filed on a non-seasonally adjusted basis. In terms of total US population, that is roughly 6% or over 12% of the labor force. This week contributed another 4.972 million to that number compared to the past two weeks which saw prints of over 6 million. Again, that 1.24 million claims decline this week is the largest decline ever recorded even though it is not much of a positive.

By now, every “normal” claims number has rolled off of the four-week moving average. As such, it has again pressed higher this week to a record of more than 5.5 million. Start a two-week free trial to Bespoke Institutional to access our interactive economic indicators monitor and much more.
Bespoke’s Morning Lineup – 4/16/20 – Tug of War at 50%
See what’s driving market performance around the world in today’s Morning Lineup. Bespoke’s Morning Lineup is the best way to start your trading day. Read it now by starting a two-week free trial to Bespoke Premium. CLICK HERE to learn more and start your free trial.
A few million here and a few million there, and pretty soon those millions start to add up. This morning, weekly jobless claims came in at 5.245 million which was below consensus forecasts for 5.5 million but still the third-highest reading on record. In other news, Housing Starts and Building Permits were mixed relative to expectations as Starts missed forecasts (1.216 million vs 1.3 million) while Permits topped expectations (1.353 million vs 1.296 million). The April Philly Fed report was expected to show a headline reading of -32 but was much weaker at -56.6. While the data was bad on an absolute basis, it could have been much worse, and as a result, futures are rallying from where they were before the report.
Read today’s Bespoke Morning Lineup for a discussion of overnight market events in Asia and Europe, some notable earnings results from Asia, Europe, and the US, the latest COVID-19 trends, and other stock-specific news of note.

After a historic rally off the March lows, the S&P 500 has been running into a little bit of resistance around the 2795 level, which happens to represent a 50% retracement of the decline from the February highs. For four days now, the S&P 500 has been dancing around that 50% retracement level with moves both above and below it. Today’s opening in the S&P 500 could put us back above the 50% retracement level, but where it finishes the day is more important.

Stocks for the COVID Economy Update — 4/15/20
Daily Sector Snapshot — 4/15/20
Netflix (NFLX) Back to Outperforming
In an earlier post, we highlighted Netflix (NFLX) as one of the stocks benefiting from the COVID-19 economy. Yesterday, it managed to reach a new 52 week high and today was up nearly 5% at the intraday high. That brings the stock to a new all time high, surpassing the previous record closing high from July 9th, 2018. That is while the broader market, the S&P 500, is down well over 2% on the day. That type of outperformance has not necessarily been the norm over the past two years. As shown in the second chart below, while NFLX tended to outperform the rest of the market (a rising line indicates NFLX outperforming the S&P 500 and vice versa) in the first half of the past five years, after its July 2018 peak, that outperformance began to subside.

Another way of showing this is performance over the last two years. At the time of the S&P 500’s high on 2/19, the performance of NFLX and the S&P 500 since mid April of 2018 were basically dead even at 25.5% and 26.5% respectively. After both saw those gains erased, NFLX’s recent surge leaves it up nearly 40% over the past two years while the S&P 500 is only up 3.5%. Start a two-week free trial to Bespoke Institutional to access our full range of research and interactive tools.
