Bespoke’s Morning Lineup – 4/24/20 – Can We Escape Corona Friday?
See what’s driving market performance around the world in today’s Morning Lineup. Bespoke’s Morning Lineup is the best way to start your trading day. Read it now by starting a two-week free trial to Bespoke Premium. CLICK HERE to learn more and start your free trial.
After trading lower overnight, US equity futures are modestly higher on the day as the market looks to escape a Corona Friday for the second week in a row. You may recall that last Friday the S&P 500 closed out the week with a gain of 2.68%, which was the second-best Friday performance for the market all year. For all of 2020, though, Fridays have been the worst day for the market with a median decline of 0.82% and gains barely even 25% of the time.
Be sure to check out today’s Morning Lineup for a rundown of the latest earnings reports, sentiment data in Germany, and the latest data on the coronavirus outbreak.

Yesterday wasn’t a great day for the biotech sector as reports that Gilead’s COVID-19 treatment remdesivir didn’t perform well in a small trial of Chinese patients. While details surrounding the data were scant, the news caused an 11.4% intraday negative reversal in GILD’s stock and also reversed what was a pretty strong market rally. GILD has over a 9% weighting in the VanEck Biotech ETF (BBH), so its reversal had an impact on that ETF as well. However, after a remarkable 31% off the March lows, which erased all of the late February/March declines, BBH still remains above its breakout point in the low $140s.

Bespoke’s Sector Snapshot — 4/23/20
Gold Bounces Right Where It Was Supposed To
With central banks around the world unleashing waves of liquidity, there have been heightened concerns that one result will be a decline in the purchasing power of our money. For that reason, a number of investors have been flocking to gold. Even before the COVID-19 crisis, gold prices had been in a solid uptrend, and while prices spiked as the crisis first began, they couldn’t quite get above the $1,650 – $1,700 range. In mid-March even, prices plummeted with just about every other financial asset before quickly recovering. Once again, though, the rally stalled at resistance. This time around, though, the 50-day moving average was strong enough to provide support and after that test, gold finally got the long-awaited breakout that investors had been waiting for.
Gold’s price spiked as high as $1,787 per ounce in mid-April before running out of momentum. When a stock or commodity breaks out above resistance to new highs and then pulls back, the former resistance level should act as support, and that is exactly what we saw this time around. This week, gold bounced right on cue at around $1,700 and has since rallied 2.6%. With the first test of support proving successful, look for gold to now establish a new range with a floor at around $1,700. At least that’s what the technical analysis textbooks would say. Start a two-week free trial to Bespoke Institutional for access to our entire suite of market research and commentary.

B.I.G. Tips – Bears Outnumber Bulls 2-to-1
Chart of the Day: Tenacity Required With Tenneco
Half of Investors Bearish Again
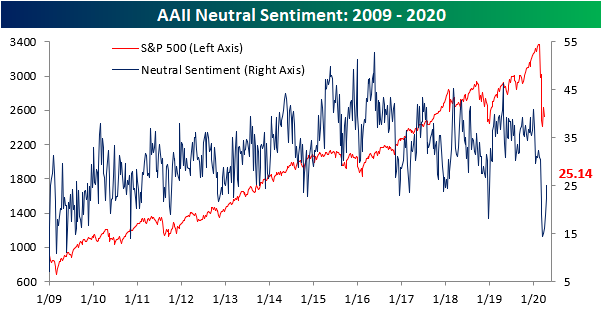
Heading into today’s session, the S&P 500 was little changed over the past week. But even if equity prices are not reflecting it, the decimation of the crude oil market has put a dent in investor sentiment. In this week’s AAII survey, only 24.86% of investors responded as bullish. That is the lowest level of bullish sentiment since the COVID-19 outbreak began! The last time the bullish reading was this low or lower was on October 10th when it was 20.31%. The 10 percentage point decline from last week’s reading of 34.86% was also the largest weekly decline since February 27th.

Whereas bullish sentiment fell, bearish sentiment rose to 50%. This is the first time since the final week of March that at least half of respondents reported as bearish, and it was the biggest jump in bullish sentiment since March 12th. The inverse moves of bullish and bearish sentiment this week has also sent the bull-bear spread to its widest level in favor of bears since last August. Today, the bull-bear spread is at -25.14. At its widest level back in early August is was slightly wider at -26.54. This week also marked the first time since April of 2013 that bearish sentiment doubled bullish sentiment.

Recently, neutral sentiment has been extremely muted. At its low in mid-March, neutral sentiment was only at 14.5%. Every week since then, neutral sentiment has ground higher reaching over 25% this week for the first time since late February. Start a two-week free trial to Bespoke Institutional to access our interactive economic indicators monitor and much more.
The Bespoke 50 Top Growth Stocks — 4/23/20
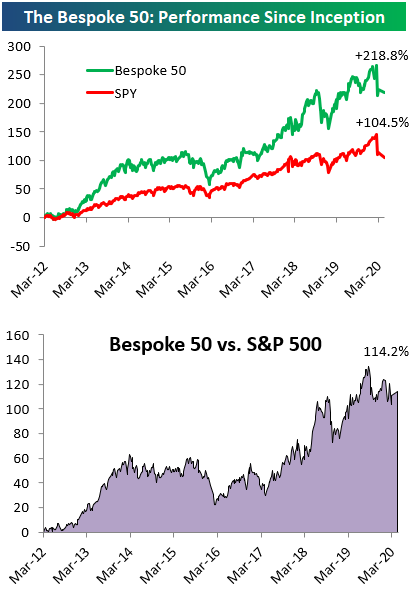
Every Thursday, Bespoke publishes its “Bespoke 50” list of top growth stocks in the Russell 3,000. Our “Bespoke 50” portfolio is made up of the 50 stocks that fit a proprietary growth screen that we created a number of years ago. Since inception in early 2012, the “Bespoke 50” has beaten the S&P 500 by 114.2 percentage points. Through today, the “Bespoke 50” is up 218.8% since inception versus the S&P 500’s gain of 104.5%. Always remember, though, that past performance is no guarantee of future returns. To view our “Bespoke 50” list of top growth stocks, please start a two-week free trial to either Bespoke Premium or Bespoke Institutional.
Another Week, Another Massive Jobless Claims Number
A massive number of people continue to file jobless claims with another 4.427 million initial jobless claims coming in this week. Similar to last week, the good news is that was less than forecasts of 4.5 million and the 4.427 million number is a drop from the 5.237 million last week. In fact, that 810K decline is the second largest on record behind last week’s 1.378 million drop. Additionally, this week was the lowest print since the first claims number above 1 million for the week of March 20th. The bad news is that regardless of the somewhat slowed pace on initial jobless claims, the numbers remain at historically unprecedented levels.

Before seasonal adjustment, this week saw 4.267 million claims filed compared to 4.965 million last week. Again, while that number is still extremely high, the past two weeks have marked a significant deceleration.
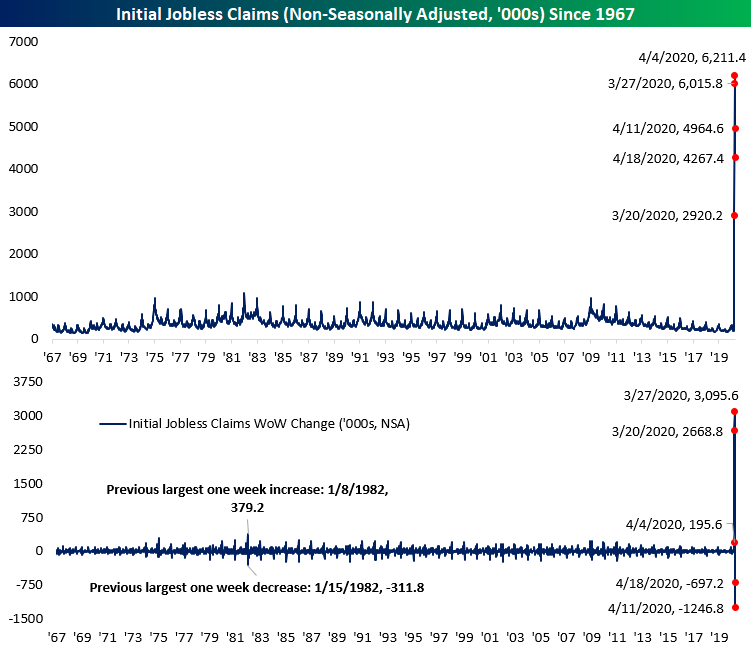
While the level of claims are off of their records from a few weeks ago, the moving average put in a new record high today. The moving average has continued to grind higher reaching 5.786 million. Granted, that 280K increase from last week was the smallest since the surge in claims began in late March.

As previously mentioned, the pace of initial jobless claims have slowed for the time being, but that does not take away from the massive number of people reporting as jobless. In total, since the beginning of March, just under 27 million Americans, or roughly 8% of the population, have filed initial jobless claims (seasonally adjusted). Although they are released with a one week lag to initial jobless claims, continuing claims this week printed at their highest level on record at 15.976 million. Start a two-week free trial to Bespoke Institutional to access our interactive economic indicators monitor and much more.

Bespoke’s Morning Lineup — 4/23/20
See what’s driving market performance around the world in today’s Morning Lineup. Bespoke’s Morning Lineup is the best way to start your trading day. Read it now by starting a two-week free trial to Bespoke Premium. CLICK HERE to learn more and start your free trial.
This morning’s update of investor sentiment from AAII showed a big drop in bullish sentiment and nearly as large an increase in bearish sentiment. We’ll have more on the details later, but below we wanted to provide a quick update on the sentiment of newsletter writers with the Investors Intelligence survey. In the latest report, the spread between bulls and bears was +12.5 percentage points, which is an improvement off the extremely negative reading of -11.6 percentage points right around the recent lows. Over the last 20 years, readings like the late March one of below -10 have been a pretty good medium to long-term buy signal. With the reading back above zero, it’s obviously nowhere nearly as extreme, but it’s still well below the 20-year average of 23.3 percentage points.
