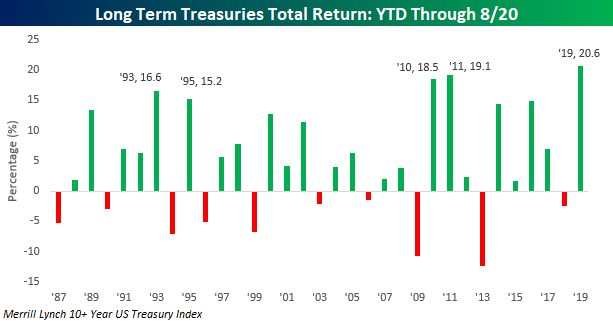
August has been an exceptionally strong month for long-term US Treasuries, adding to what has already been an extremely strong year. Through yesterday, the Merrill Lynch 10+ Year Treasury Index’s YTD total return crossed 20%, making it the first year since at least 1987 that long-term US Treasuries were up over 20% YTD through 8/20. What does that kind of move in US Treasuries mean for the equity market going forward? In today’s Chart of the Day, we shed some light on this question through an analysis of equity market performance following similar intermediate and short-term moves in the past.
To view the report and see what history suggests going forward, start a two-week free trial to any of our research membership levels. You’ll be glad you did!