August 2020 Headlines
B.I.G. Tips – S&P 500 2%+ Declines From a Record High
Bespoke’s Morning Lineup – 9/4/20 – Let’s Try This Again
See what’s driving market performance around the world in today’s Morning Lineup. Bespoke’s Morning Lineup is the best way to start your trading day. Read it now by starting a two-week free trial to Bespoke Premium. CLICK HERE to learn more and start your free trial.
“The eyes are more exact witnesses than the ears.” – Herclitus
Yesterday was an ugly day, although many people we spoke with were surprised that both the S&P 500 and Nasdaq had similar but larger reversals back in June, so it’s not as though the move was unprecedented. There’s no arguing the market was a bit frothy, especially in large-cap tech, heading into Thursday’s rout, so some mean reversion is to be expected.
In the short-term, the worst may not be over for big-tech. It remains the most overbought sector of the market, and continued tensions with China, the latest being reports that the country will increase support for its domestic semiconductor industry, only adds to the tensions.
In Europe, the region is seeing its second straight day of disappointing economic data. The focus for the short-term in US markets, though, is the August Non-Farm Payrolls report. Economists were expecting 1.35 million jobs, the Unemployment Rate is expected to drop back below 10% to 9.8%, and average hourly earnings are expected to remain unchanged. The actual results were much stronger than expected. While job creation was only slightly better than expected (1.371 million), the Unemployment Rate dropped to 8.4%, and Average Hourly Earnings increased 0.4%.
Be sure to check out today’s Morning Lineup for a rundown of the latest stock-specific news of note, market performance in the US and Europe, trends related to the COVID-19 outbreak, and much more.

As mentioned above, even after yesterday’s sell-off, many sectors remain overbought. In fact, the only sectors not trading more than a standard deviation above their 50-day moving averages (DMA) are Utilities, Health Care, and Energy. Energy is also the only sector currently trading below its 50-DMA, while Technology is still trading 7.2% above its 50-DMA, which ranks third of the eleven sectors just slightly behind Communication Services (+7.24%) and Consumer Discretionary (+7.23%).

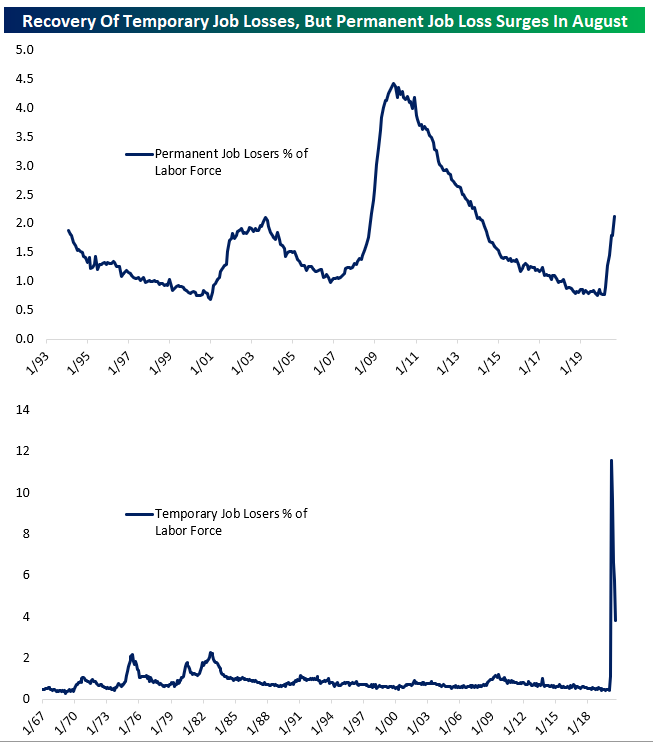
Under The Surface, The Labor Market Weakened In August
Headline statistics from the Bureau of Labor Statistics Employment Situation Report on Friday morning showed further labor market recovery from COVID. But under the surface, August had significant labor market deterioration. While payrolls beat, the unemployment rate fell faster than expected, wages were stronger than expected, and hours worked rose against expectations, the number of Americans who are on permanent layoff (involuntarily unemployed and looking for work) rose by more than 500,000, and their share of the overall labor force is now the same as during the peak of the early-2000s recession.
While the huge drop in temporarily laid-off workers that has been ongoing for several months continued, widening of permanent job loss suggests that the labor market is still deteriorating as businesses close, reduce output, or are forced from re-opening thanks to the ongoing economic impact of COVID. While the headline numbers were welcome, it’s important to understand that they don’t tell the full story. Please note both charts below show data for all periods it is available. For more on the jobs report, try out a Bespoke subscription to receive our weekly Bespoke Report in your inbox this evening. Click here to start a two-week free trial.
The Bespoke 50 Top Growth Stocks — 9/3/20
Every Thursday, Bespoke publishes its “Bespoke 50” list of top growth stocks in the Russell 3,000. Our “Bespoke 50” portfolio is made up of the 50 stocks that fit a proprietary growth screen that we created a number of years ago. Since inception in early 2012, the “Bespoke 50” has beaten the S&P 500 by 154.0 percentage points, which hit a new high this week. Through today, the “Bespoke 50” is up 304.8% since inception versus the S&P 500’s gain of 150.8%. Always remember, though, that past performance is no guarantee of future returns. To view our “Bespoke 50” list of top growth stocks, please start a two-week free trial to either Bespoke Premium or Bespoke Institutional.

Bespoke’s Weekly Sector Snapshot — 9/3/20
All or Nothing Days Make a Comeback
For those unfamiliar with the term, we consider an “all or nothing day” to be one where the S&P 500’s net daily A/D (advance/decline) reading is greater than +/-400. Earlier this year when the market was going haywire due to the COVID outbreak and subsequent lockdowns, all or nothing days were occurring nearly every other day. In the 50 trading days from 2/21 through 5/1, there were a total of 22 all or nothing days, which works out to 44% of trading days. Going back to 1990, there were only two other periods where the percentage of all or nothing days was higher. The first was in the 50 days ending 12/5/08 while the highest frequency of all or nothing days over a 50-day period was in the second half of 2011. After a 45-trading day lull with no occurrences, all or nothing days are attempting a comeback as the S&P 500 has now seen back to back all or nothing days for the first time since March

As far as for where the frequency of all or nothing days this year ranks compared to other years, 2020 already ranks in the top six of all years since 1990, and there are still nearly four months left to go! If the current pace of all or nothing days this year keeps up through year-end (a big if given that these types of days tend to occur in bunches), 2020 would see a total of 49 all or nothing days, and that would rank as the third-highest for all years since 1990 (2011 – 70 and 2008 – 52). With fall and the most volatile time of the year now upon us, we may just get there. Click here to view Bespoke’s premium membership options for our best research available.

Chart of the Day: Nasdaq Close to a Record Reversal
Late Summer Service Slip
On Tuesday, ISM’s reading on the manufacturing sector rose by more than expected, but the service counterpart released today saw the opposite results. The headline index was expected to fall to 57 but instead fell by slightly more with the headline number coming in at 56.9. Although lower than the past two months, that is still indicative of expansionary activity in the service sector as the index remains at some of the highest levels of the past two years. The same can be said for the composite index which outside of last month, is at its highest level since February of last year.


Breadth in this month’s report was fairly mixed. The majority of indices rose month over month with the biggest increases in prices, exports, and employment. On the other hand, three indices fell and two are in contraction. Of the indices that did fall, the declines were historically large.

The index that experienced the most dramatic decline was that for New Orders. Last month, this index was at a record high of 67.7, but in a complete 180, the index had its second-largest decline on record in August (behind April’s 20 point decline) and is now in the middle of its historical range. That does not mean that there was an overall decline in new orders though. The level of 56.8 still indicates demand grew in August, just at a slower rate than in July.

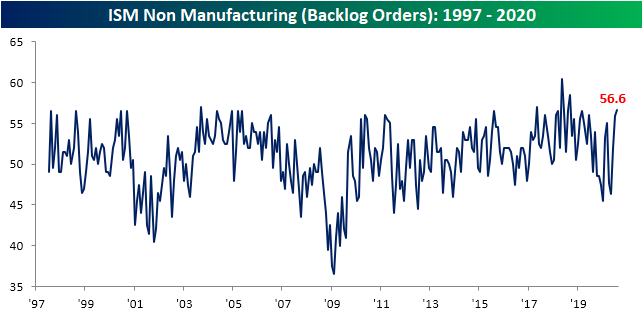
Even though new demand was not as strong, businesses still have plenty on their plates as is evident through the index of Backlog Orders. The index for Backlog Orders rose to 56.6 from 55.9. That is in the 98th percentile of all readings as the index is currently at its highest level since May of 2018.
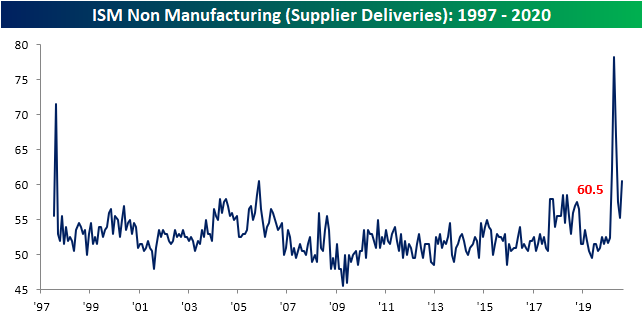
The attempt to fill the growing number of orders has led to inventory drawdowns. The index for Inventories showed a contractionary reading of 45.8. That compares to an expansionary reading of 52 last month. Outside of March’s even lower reading of 41.5, you would have to go back to February of 2010 to find the next lowest reading of this index. Additionally, as inventories have fallen, other supply chain issues seem to have appeared. The index for Supplier Delivers in which higher readings point to longer lead times, experienced its sixth-largest monthly increase on record. That increase brings the index to 60.5 which is tied with November of 2005 for the fifth-highest reading on record.

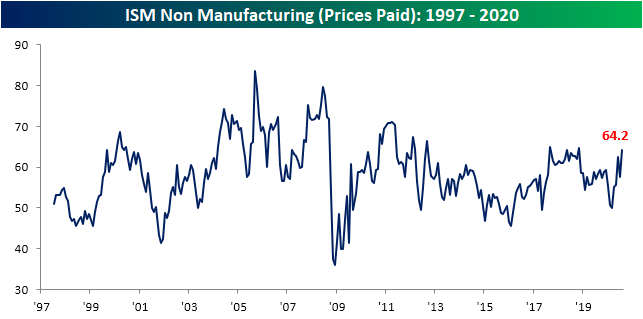
With stronger demand, falling inventories, and greater difficulty getting products from suppliers in a timely manner, it makes intuitive sense that prices are rising fairly rapidly. The index for prices paid rose to 64.2 which is the highest level since November of 2018.
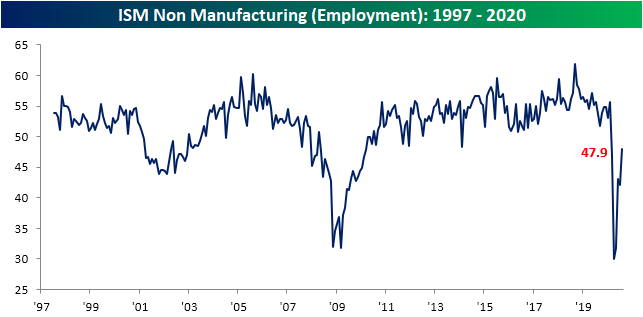
Perhaps the measure that has remained the weakest has been employment. Since the low in April, the index for Employment has risen every month except for last month. Even though it was higher again in August, it has shown a sixth straight contractionary reading. Although more businesses are reporting lower than higher levels of employment, the commentary section of the report did offer some hope. One comment noted that “The need for employees is greater, but we are having a difficult time filling open positions” while another stated that “hiring is authorized, but slow to materialize”.Click here to view Bespoke’s premium membership options for our best research available.
DocuSign (DOCU) Has Been an Earnings Beast
After the close today, DocuSign (DOCU) is scheduled to report third-quarter earnings. Below is a snapshot of DOCU from our popular Earnings Explorer tool, which allows users to pull up historical earnings results for nearly all publicly traded US companies. Over the past couple of years, this stock has been stellar on earnings. DOCU has yet to miss estimates on top-line sales and has only missed EPS once (its Q3 report last year). As for forward projections, the company has actually raised guidance on every single one of its eight quarterly reports as a public company. That means that DOCU has reported a triple play (beat EPS, beat revenues, raised guidance) in seven of the eight reports on record.
Despite consistently making the list of earnings triple plays, stock price reactions for DOCU have been a coin-flip. On its eight historical earnings reports, the stock has only risen on its earnings reaction day 50% of the time.


Based on its earnings history, it is a 50/50 chance that the stock will react positively to results tonight, but headed into earnings, the chart of DOCU is much less extended than it was just a few days ago. In the past week, DOCU surged to new highs that briefly brought it out of the past several months’ uptrend channel. In the past two sessions, though, it has pulled back to the middle/lower end of this channel. This pullback at least gives the stock some breathing room when it reports after the close. You can gain access to Bespoke’s Earnings Explorer with a Bespoke Institutional membership. Click here to start a two-week free trial today!
