Chart of the Day: Tesla (TSLA) and the Biggest Dot Com Winners
Downed Dollar
Falling another 0.35% today, the Bloomberg US Dollar Index is notching its fourth consecutive day with a decline. Over the past four days, the greenback has fallen 1.38% which was the worst four-day stretch since the first days of June. Not only is that resulting in the US Dollar Index reaching extremely oversold levels as it currently sits 2.25% from its 50-DMA, but it also now sits at a critical technical level. Before rocketing up to a record high on March 23rd, on March 9th the dollar index found a bottom at 1190.98. That is around similar levels to the mid-December 2019 and just above December 31st, 2019 lows. With today’s decline, the dollar index has now dropped 8.17% from the March high, marking a full round trip from its pre-COVID spike. Click here to view Bespoke’s premium membership options for our best research available.

Triple Plays Triple
In yesterday’s Chart of the Day, we highlighted one of the most recent earnings triple plays, Prologis (PLD), as well as the other three triple plays so far this earnings season as of yesterday morning. A stock reports an Earnings Triple Play when it beats consensus analyst EPS estimates, beats revenue estimates, and raises forward guidance. These can typically be considered the cream of the crop for companies reporting earnings as they not only show fundamental strength, but also see strong stock price reactions on earning days. As the earnings calendar continuously ramps up, another 54 companies reported since yesterday’s close and the number of triple plays has nearly tripled. There were seven triple plays since yesterday’s close bringing the total for this earnings season from four to eleven.
Below we show the charts of the stocks that have reported a Triple Play last night and this morning. Teradyne (TER) and Texas Instruments (TXN) were both out yesterday after the close. For Teradyne, EPS was 30 cents above analyst forecasts of $1.03 while revenues came in at $839 million versus forecasts of $755.5 million. TXN beat EPS by 27 cents. The company reported sales of $3.239 billion versus estimates of $2.952 billion. Both companies raised guidance for sales and EPS. Despite those strong earnings, both stocks are trading lower today as they sit just off of 52-week highs. For TXN, that turn lower marks a false break out above levels from earlier this year.
This morning’s triple plays include fiber optic cable manufacturer Amphenol (APL), industrial products conglomerate Dover (DOV), health information technology stock IQVIA (IQV), consumer packaged goods company Silgan (SLGN), and one of the US’s largest trucking companies Knight-Swift (KNX). Unlike TXN and TER, none of these stocks are trading lower and SLGN is up the most with a 7.56% gain as of this writing. This was SLGN’s first-ever triple play with EPS of $0.85 vs $0.64 estimates and revenues ~$55 million above estimates. That has sent SLGN surging to fresh 52-week highs. APH, DOV, and IQV are not quite there yet but they too are approaching resistance with help from earnings today. KNX on the other hand is in the middle of a strong uptrend since the March lows.
One other interesting thing to note, even though these companies are all reporting strong earnings in relation to estimates, most are not reporting growth from last year. Of the eleven triple plays we have seen so far this earnings season, there are only four—Taiwan Semi (TSM), Prologis (PLD), Silgan (SLGN), and Teradyne (TER)—that have reported revenues higher than one year ago. Click here to stay updated on upcoming earnings triple plays and receive actionable research on everything else related to financial markets.

Silver Gets the Gold for YTD Performance
In last night’s Closer, we took a look at the massive rallies of late in the precious metals space. Gold (GLD) reached its highest level since 2011, but silver’s (SLV) performance on the day was even more of a sight to behold with gains in the top 1% of all days since SLV began trading in 2006. Silver (SLV) rose 6.15% for its best day since March 24th when the metal rose 7.96%. Whereas the silver to gold ratio has been in a constant downtrend over the past decade (indicating underperformance of silver relative to gold), yesterday’s big gains led to a breakout of this downtrend. With SLV trading higher by over 5% yet again this morning, that downtrend is being broken even more significantly, and that is even with SLV off the pre-market highs above $21.

As recently as the final days of June, SLV was actually sitting on a loss year to date. That was a far cry from the performance of some of the best-performing assets of the year at the time like the Tech heavy Nasdaq 100 (QQQ) which was up over 14% and the long term Treasuries ETF (TLT) which was up over 21.5%. Silver’s yellow cousin, gold, was likewise sitting on a sizeable gain of 16.6%. Pivot ahead to today and the picture is very different. Around this morning’s premarket highs when SLV was trading above $21, it actually topped QQQ, TLT, and GLD as the best performing asset in 2020. That is even with each of these other ETFs also trading higher. Click here to view Bespoke’s premium membership options for our best research available.

Bespoke’s Morning Lineup – 7/22/20 – Less Value in Growth
See what’s driving market performance around the world in today’s Morning Lineup. Bespoke’s Morning Lineup is the best way to start your trading day. Read it now by starting a two-week free trial to Bespoke Premium. CLICK HERE to learn more and start your free trial.
Futures are mixed this morning but off their overnight lows following the US closure of the Chinese consulate in Houston. Data flow is quiet this morning, but the pace of action is going to pick up substantially with earnings after the close from Microsoft (MSFT) and Tesla (TSLA) among others. The big question will be whether or not these companies can live up to the higher expectations that have been building up in the weeks leading up to these reports.
Be sure to check out today’s Morning Lineup for a rundown of the latest stock-specific news of note, key earnings news in Europe and the US, global economic data, trends related to the COVID-19 outbreak, and much more.

With each passing day, as growth stocks seemingly move in one direction (higher) and value stocks remain stagnant and drift lower, the spread in performance between the two investment strategies continues to widen. In the 100 trading days through Monday, the S&P 500 Growth index was up over 14% while the S&P 500 Value index declined 8% for a spread of 22.5 percentage points. When was the last time the spread got that wide? Well, never since at least 1996.
The chart below shows the rolling 100-trading day spread between the performance of the S&P 500 Growth and Value indices going back to 1996. Prior to Monday, the record spread between the two indices was 22.1 percentage points which was reached during the dot-com boom in December 1999. Besides that period, the only time the spread was even close to current levels was in March 2009 when it topped 17 percentage points. In other words, the last two times the performance spread between the S&P 500 Value and Growth indices was anywhere close to as wide as it is now represented one of the worst and the best entry points for the broader market in the last 25 years. Make sense of that.

Daily Sector Snapshot — 7/21/20
B.I.G. Tips – Nasdaq 4-Month Rate of Change Tops 50%
Bespoke Stock Scores — 7/21/20
Chart of the Day: Keeping Tabs on Triple Plays
Mixed Results From Global Data Points Last Night
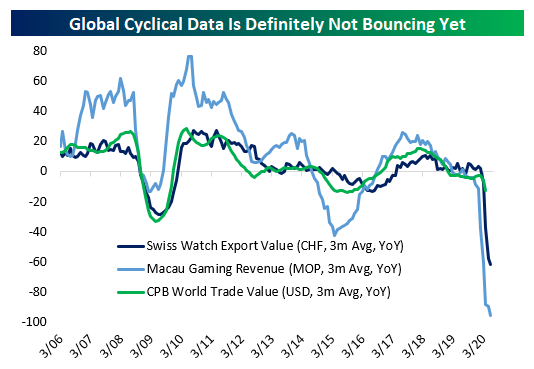
Below is analysis included in today’s Morning Lineup. You can receive the Morning Lineup in your inbox each day with a Bespoke Premium or Bespoke Institutional membership. Click here to start a two-week free trial. Last night we got a couple of interesting data points about the state of the global economy. The first is near-real-time in the form of Korean trade data for the first 20 days of the month of July. As shown in the chart below, YoY rates of change bounced huge in June after enormous declines in April and May. Unfortunately, the bounce is not continuing, and preliminary trade data continues to run at a -13% YoY pace for the month.

That’s consistent with slightly more lagged alternative indicators that tend to do a good job following the global economic cycle. Swiss watch exports data updated last night showed a very large decline of about one-third YoY; that’s a huge improvement on the two-thirds decline in May, but between that and still-weak performance of Macau’s casinos, it’s hard to find a data point suggesting a robust recovery in economic activity volumes and animal spirits across the global economy.
Where there’s room for hope is in capital expenditures as proxied by the machine tool orders data released each month by Japan’s trade association of manufacturers in that category. This data is very timely, with the revised June numbers showing a little more detail than the headline release a couple of weeks ago. As shown below, Chinese orders have surged while American customers are also stepping up to by at a much faster clip than the last couple of months. While the EU bounce looks small, even that amounts to 10% sequential improvement. These series have a long way to go to get back to “normal” but they’re at least on that path for now. We went into further detail on contribution to total earnings as well as YTD gains in last night’s Closer report, which is available to Bespoke Institutional members. Click here to start a two-week free trial.
