Bespoke’s Morning Lineup – 7/24/20 – Tech Tired
See what’s driving market performance around the world in today’s Morning Lineup. Bespoke’s Morning Lineup is the best way to start your trading day. Read it now by starting a two-week free trial to Bespoke Premium. CLICK HERE to learn more and start your free trial.
It’s not feeling like a Friday in the financial markets this morning as negative earnings from Intel (INTC) weigh on sentiment. S&P 500 futures are indicated to open down about 0.4% while the Nasdaq is taking it much harder with a decline of 1%. While traders couldn’t get enough of big tech last week, they cant get away from it fast enough this week.
Be sure to check out today’s Morning Lineup for a rundown of the latest stock-specific news of note, key earnings news in Europe and the US, global PMI data, trends related to the COVID-19 outbreak, and much more.

The majority of companies have been reporting better than expected EPS and revenues this earnings season, and most of these positive surprises have been greeted with rising stock prices. One exception, though, appears to be large-cap tech. The latest examples this week include Microsoft and Intel. While both stocks reported better than expected EPS and sales, their earnings reports have been met with selling. In the case of MSFT yesterday, its 4.35% decline was the most negative earnings reaction for the stock in more than four years. INTC, meanwhile, is already trading down over 13% in reaction to earnings after issuing a weak forecast. The last time it had a worse one-day reaction to earnings? 2002.
The sell the news reaction we’re seeing so far in tech is the result of two things. First, the stocks have run so much heading into earnings season that the bar was set extraordinarily high. Second, valuations. The chart below shows where the current P/E ratios of S&P 500 sectors stand relative to their 10-year averages. Currently, the S&P 500 is in the 99.9th percentile relative to all other periods in the last ten years, and that high reading is being driven by lofty valuation in Consumer Discretionary (99.8th percentile) and Technology (99.6th percentile).

Bespoke’s Weekly Sector Snapshot — 7/23/20
Bears Still Outweigh Bulls
Although the S&P 500 is up around 1% over the past week with the index clearing the technical hurdle of the early June highs around 3,230, sentiment has shifted lower. Just last week, AAII’s reading on bullish sentiment rose above 30% for the first time in four weeks. That didn’t hold as bullish sentiment fell to 26.06% this week.

While the percentage of investors reporting as bullish fell, there was only a small increase in the number of investors reporting as pessimistic. 46.83% of respondents reported bearish sentiment; a 1.46 percentage point increase from last week. That is the smallest change on an absolute basis for bearish sentiment since the final week of June while marking the highest level of bearish sentiment since the same week.

That means neutral sentiment saw the biggest move of the three as it gained 3.32 percentage points. Now at 27.11%, neutral sentiment is making its way back up to its recent highs above 30%, though it is still in the bottom 18% of all readings since the beginning of the survey in 1987.

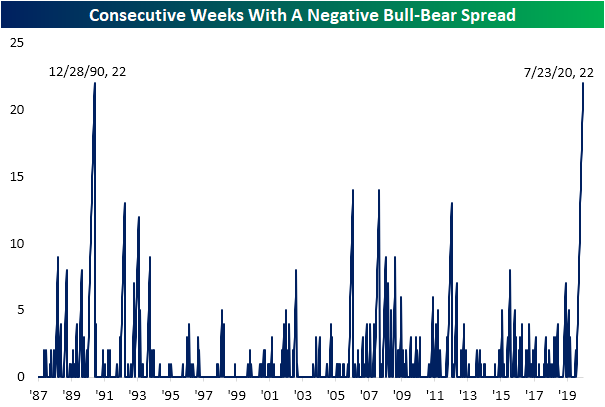
Although there were no major shifts in sentiment readings this week, there was one significant development. Tipping back below -20 this week, every week since the last week of February has seen a negative bull-bear spread(a higher share of survey respondents report as bearish than bullish). At 22 consecutive weeks long, that ties another streak that came to an end in the final week of 1990 for the longest stretch on record in which bears have outweighed bulls. While it is too small of a sample size to put much weight on it, the S&P 500 was higher by 14% six months out from the end of that last streak. Click here to view Bespoke’s premium membership options for our best research available.

The Bespoke 50 Top Growth Stocks — 7/23/20
Every Thursday, Bespoke publishes its “Bespoke 50” list of top growth stocks in the Russell 3,000. Our “Bespoke 50” portfolio is made up of the 50 stocks that fit a proprietary growth screen that we created a number of years ago. Since inception in early 2012, the “Bespoke 50” has beaten the S&P 500 by 151.3 percentage points. Through today, the “Bespoke 50” is up 288.4% since inception versus the S&P 500’s gain of 137.1%. Always remember, though, that past performance is no guarantee of future returns. To view our “Bespoke 50” list of top growth stocks, please start a two-week free trial to either Bespoke Premium or Bespoke Institutional.

Nuance of Jobless Claims
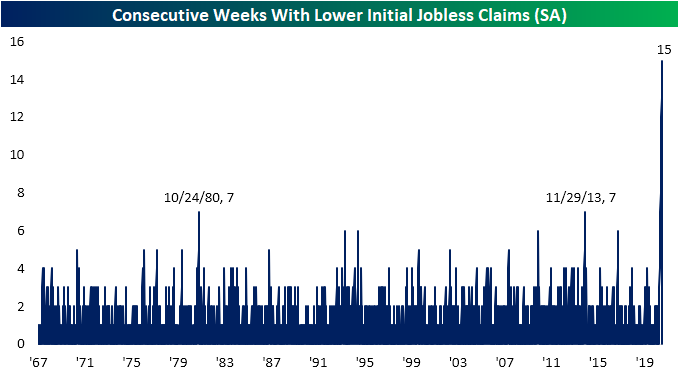
Seasonally adjusted jobless claims have been consistently declining since their peak on March 27th. In fact, up until this week, claims had fallen for a record 15 consecutive weeks. That more than doubled the previous record streaks that ended at seven weeks long in 2013 and 1980.
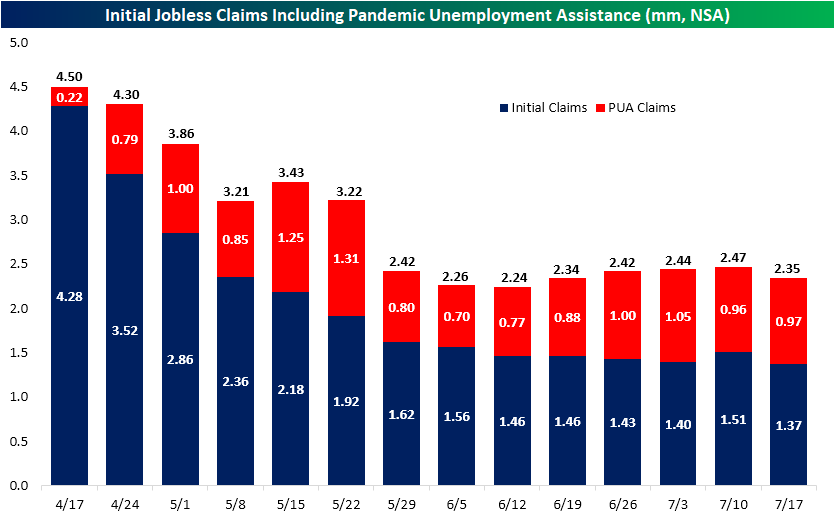
This week’s 1.416 initial jobless claims reading was not only the first time claims have risen on a week over week basis since March, but they also came in above expectations. Given the degree of improvement has been small in recent weeks, the 109K increase means that initial jobless claims have now given up all of the declines since the week of June 19th.
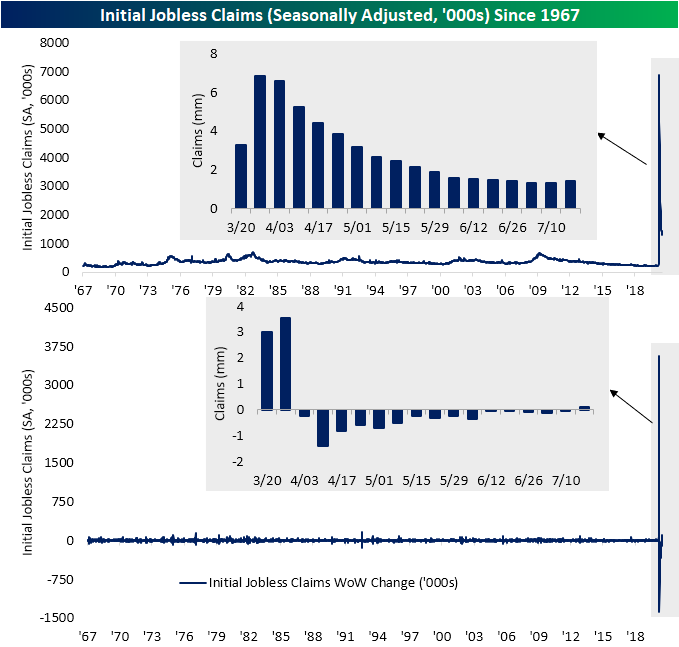
While the seasonally adjusted number makes for a worsening picture, claims appear a bit better when looking at the unadjusted number. After an uptick last week, on a non-seasonally adjusted basis, claims were actually lower this week falling to 1.371 million from 1.513 million last week. That was actually the largest week over week decline since the last week of May.

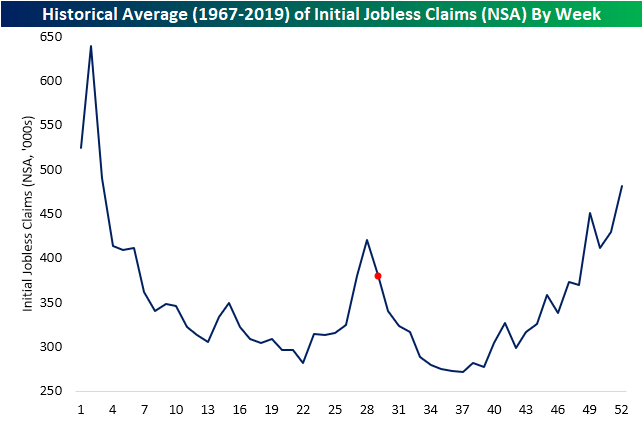
While that is an improvement, we would be hesitant to give this too much weight. While seasonal effects may be a bit diluted this year given other bigger factors, they are in play nonetheless and last week’s increase as well as this week’s decline are prime examples of this effect. In the chart below we show the average reading for claims for each week of the year from 1967 through last year. As shown, last week (the 28th of the year) has typically marked a seasonal peak for jobless claims with the current week (red dot in the chart below) marking the initial decline off that seasonal peak which is similar to what has been observed in recent weeks. In other words, the past couple of week’s moves at least in part appear to be a result of seasonality.
When including Pandemic Unemployment Assistance (which are non seasonally adjusted), it is more of the same with total claims lower than last week. That snapped a four-week streak of increases, but again,those past few weeks’ increases are consistent with the historical seasonal pattern for this time of year.
As for continuing claims, which are lagged an extra week, the declines continued with this week marking a seventh consecutive decline. Continuing claims dropped 1.107 million to 16.197 million. This week was the largest decline of those seven weeks with the only larger decline being a 4.071 million drop in mid-May.
Additionally, albeit lagged an additional week in the most recent data, continuing claims have also fallen when factoring in PUA claims. Total continuing claims (non-seasonally adjusted) for the week of July 3rd has dropped for two weeks in a row down to 30.5 million. Click here to view Bespoke’s premium membership options for our best research available.
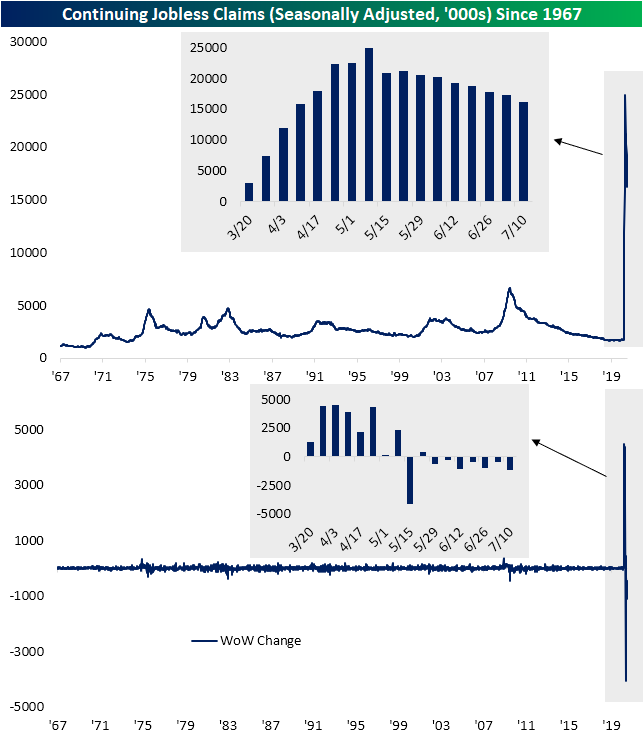
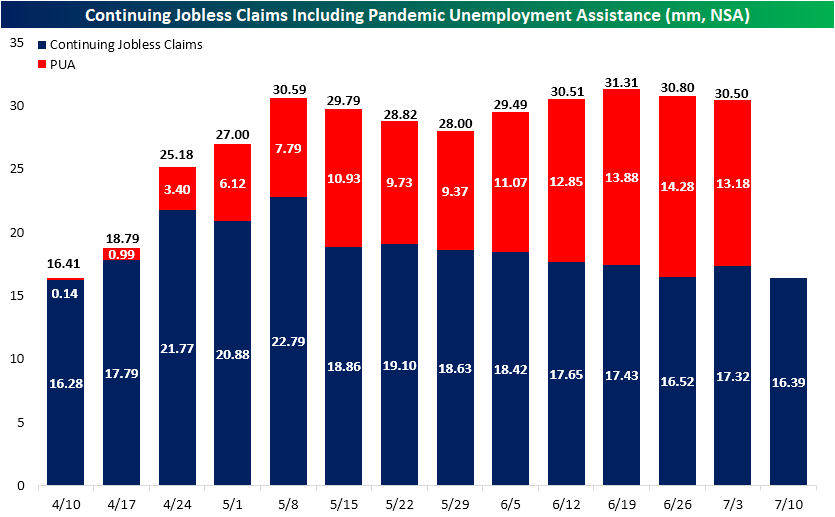
Chart of the Day: The Myth of Robinhood
Bespoke’s Morning Lineup – 7/23/20 – Funk-Less Nasdaq
See what’s driving market performance around the world in today’s Morning Lineup. Bespoke’s Morning Lineup is the best way to start your trading day. Read it now by starting a two-week free trial to Bespoke Premium. CLICK HERE to learn more and start your free trial.
Futures started to rally ahead of the European open, and have given up some of those gains as we head into the trading day. The key stock to watch today will be Microsoft (MSFT), which despite positive earnings is trading lower in the pre-market. The stock had a strong run leading into the earnings report, so it’s understandable that investors took profits, but we’ll have to watch to see if this type of reaction to earnings becomes a trend.
Be sure to check out today’s Morning Lineup for a rundown of the latest stock-specific news of note, key earnings news in Europe and the US, global economic data, trends related to the COVID-19 outbreak, and much more.
Whenever the market strings together daily declines, it’s often referred to as being in a funk. In the case of the Nasdaq, though, the last two months have been ‘funk-free’. With yesterday’s gain, the Nasdaq has now gone 48 trading days without seeing back to back declines. In the entire history of the Nasdaq dating back to 1971, this current streak is now tied for the longest streak of all-time. Not only that but because yesterday was positive, the current streak is guaranteed to go at least another trading day.

Daily Sector Snapshot — 7/22/20
Bespoke CNBC Appearance (7/22)
Bespoke co-founder Paul Hickey appeared on CNBC’s Squawk Box on Wednesday morning to discuss the Technology sector heading into earnings season. To view the segment, click on the image below.
