Bespoke’s Morning Lineup – 8/7/20 – 1.5 Million. Higher or Lower?
See what’s driving market performance around the world in today’s Morning Lineup. Bespoke’s Morning Lineup is the best way to start your trading day. Read it now by starting a two-week free trial to Bespoke Premium. CLICK HERE to learn more and start your free trial.
“The four most dangerous words in investing are: this time it’s different.” – Sir John Templeton
1.5 million. That’s the key number for the day. Will the July Non-Farm Payrolls report come in higher or lower than that? Concerns have risen in recent weeks that renewed restrictions due to the COVID outbreak would hurt employment, and today’s report will shed light on those concerns. Whatever the number comes in at, keep in mind that there is clear evidence that the latest wave of the outbreak is receding, so that should help numbers going forward.
Be sure to check out today’s Morning Lineup for a rundown of the latest stock-specific news of note, key earnings and economic news in Europe and the US, trends related to the COVID-19 outbreak, and much more.

Wednesday was the 150th trading day of the year, and during that time the Nasdaq 100 has been up 64% of the time. In the history of the index since 1985, there have only been two other years where the winning percentage of the index was stronger at this point in the year. In 2017, Nasdaq 100 was up on the day 66% of the time in the first 150 trading days of the year while in 1995, it was up 64.7% of the time. While there have been times when the Nasdaq 100 was slightly more automatic than it has been in 2020, it hasn’t been often.

Bespoke’s Weekly Sector Snapshot — 8/6/20
Chart of the Day: How Far We’ve Come
The Bespoke 50 Top Growth Stocks — 8/6/20
Every Thursday, Bespoke publishes its “Bespoke 50” list of top growth stocks in the Russell 3,000. Our “Bespoke 50” portfolio is made up of the 50 stocks that fit a proprietary growth screen that we created a number of years ago. Since inception in early 2012, the “Bespoke 50” has beaten the S&P 500 by 168.2 percentage points, which hit a new high this week. Through today, the “Bespoke 50” is up 309.5% since inception versus the S&P 500’s gain of 141.3%. Always remember, though, that past performance is no guarantee of future returns. To view our “Bespoke 50” list of top growth stocks, please start a two-week free trial to either Bespoke Premium or Bespoke Institutional.

Individual Investors Still Don’t Believe
As mentioned in a prior post, in the past week the S&P 500 has moved within 2% of its 2/19 high, but at the same time, less than a quarter of AAII respondents are optimistic for the future of stocks over the next six months. That begs the question- if there have been past times that sentiment and price action have been so detached from one another. Since the start of the AAII survey in 1987, there have been 10 periods (including the current one) in which the S&P 500 was within 2% of an all-time high but bullish sentiment was less than 25% without another occurrence in the prior three months. The most recent prior occurrence was not even a full year ago. Back in October, sentiment was only slightly higher as the S&P 500 was 1.84% from its all-time high. Prior to that, there were some scattered instances throughout 2013, 2015, and 2016 but before that, you would have to go back to 1993 to find another similar period. The one occurrence in 2013 stands out as it was both the lowest sentiment reading of these prior occurrences and the only one that occurred with the S&P 500 right at an all-time high.
As for where things stand after such instances, sentiment has tended to reverse higher in the following six months as the S&P 500 has tended to move higher. The S&P 500 has actually tended towards better than average returns over the next three months, although performance six months out has been modestly worse than average, even as it has been higher more often than not. Additionally, as shown in the second chart below, of the more recent occurrences of the past decade, they haven’t marked any major top or bottom for the S&P 500 with occurrences clustered both coming off of lows and in the middle of longer-term uptrends. Click here to view Bespoke’s premium membership options for our best research available.


Sentiment Low, S&P 500 High
Although the S&P 500 has risen 2.35% over the past week and is now within 2% of its all time high on February 19th, sentiment saw little changes this week. In AAII’s weekly survey, only 23.29% of investors reported as bullish on the direction of stocks over the next six months. That is up roughly 3 percentage points from last week’s reading of 20.23% which was the lowest reading on bullish sentiment since May of 2016.

Meanwhile, bearish sentiment also moderated slightly falling to 47.6% from 48.47%. Although lower week over week, that is still 17 percentage points above its historical average, and it has been more than one standard deviation above that average for 20 of the past 22 weeks.
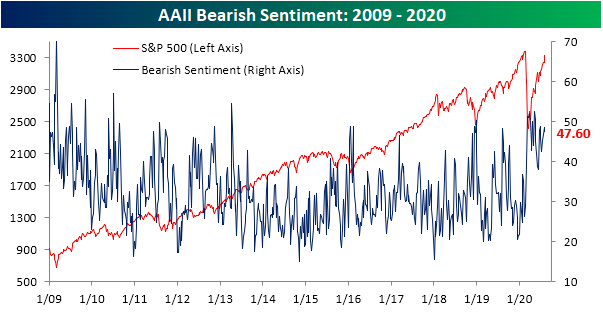
Neutral sentiment was also slightly lower this week down from 31.3% to 29.11%. Click here to view Bespoke’s premium membership options for our best research available.

Silver Takes the Gold
Gold and silver prices were already on a tear heading into this week, but they’ve only seen their gains accelerate even more. With more than a day and a half of trading left in the week, front-month gold futures have rallied, but silver has been the real show stopper with a gain of 16%!
Taking a look at a one-year chart of silver over the last year, things have really gone parabolic this week as the front-month futures contract is trading more than 40% above its 50-day moving average (DMA) and 62% above its 200-DMA.

Were it not for the move in silver, gold’s move would be getting all the attention. Prices for gold have also seen a major surge in the last month, rising from under $1,800 to the current level of $2,060 per ounce. While not as extended as silver, gold currently trades 14% above its 50-DMA and 26% above its 200-DMA.

With gold 25.7% above its 200-DMA and silver 62.2% above, the average spread of the two commodities currently stands at 44.3%. In the 40+ year history of the two futures contracts, there have only been a handful of prior periods where the average spread of the two commodities was larger or even above 35% for that matter with the most recent occurring back in early 2011. This recent rally in the two commodities has certainly been one for the ages. Click here to view Bespoke’s premium membership options for our best research available.

NSA Jobless Claims Finally Drop Below One Million
The first initial jobless claims release of August was a welcome surprise ahead of tomorrow’s Nonfarm Payrolls report. Seasonally adjusted claims came in at 1.186 million which was the lowest level since the start of the pandemic albeit still indicating over 1 million people filed a jobless claim for the first time. That has now been the case for 20 straight weeks. That was a 249K drop from last week as well which was the largest week over week decline for initial claims since the first week of June.
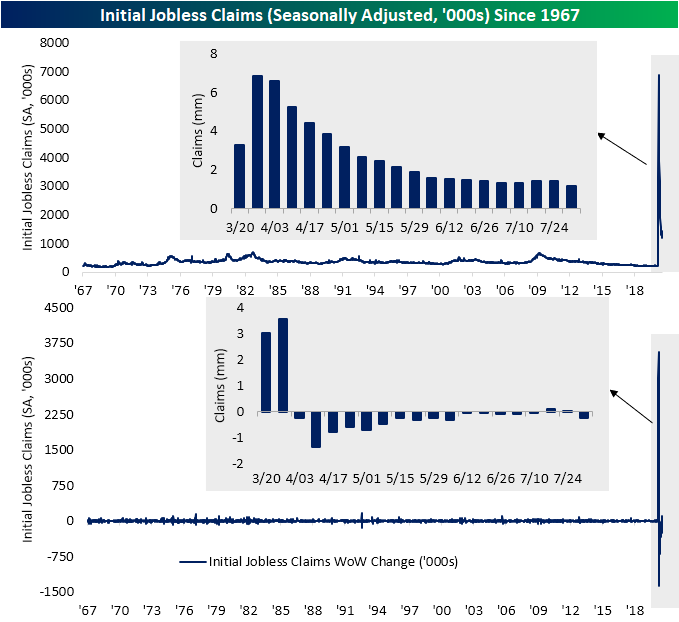
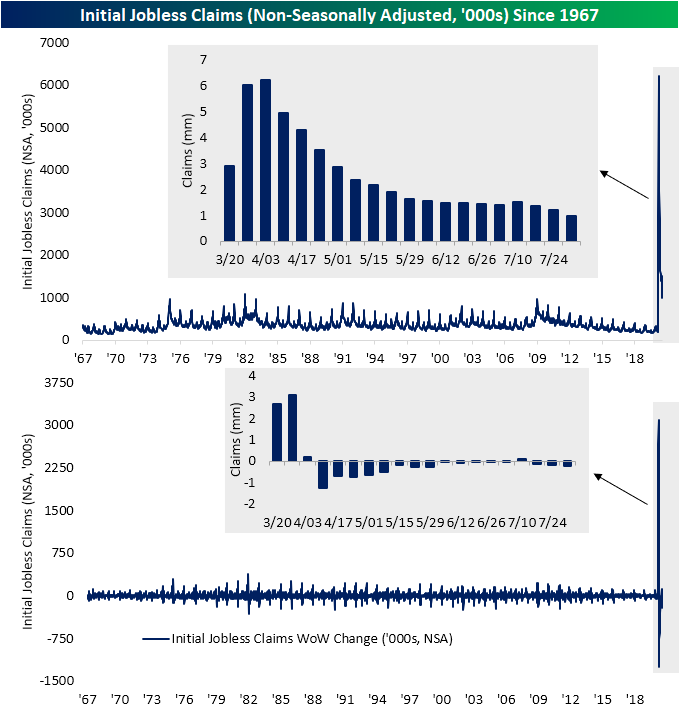
On a non-seasonally adjusted basis, it was an even more welcome reading as claims were actually below 1 million for the first time since mid-March. The 222K drop from last week down to 984K also marked yet another acceleration in the WoW declines as well (169.9K drop last week and 135.9K decline the prior week). As we have noted in recent weeks, seasonality is likely in part a factor for the stronger NSA numbers as claims have had a tendency to fall during the summer months (July through September), but fewer people filing for claims is a good sign regardless.
Last week was the first time continuing claims rose in nearly two months, but the entire 800K increase has been reversed and then some this week as continuing claims fell back down to 16.107 million. That is the lowest reading since April 10th when continuing claims stood at 15.819 million.
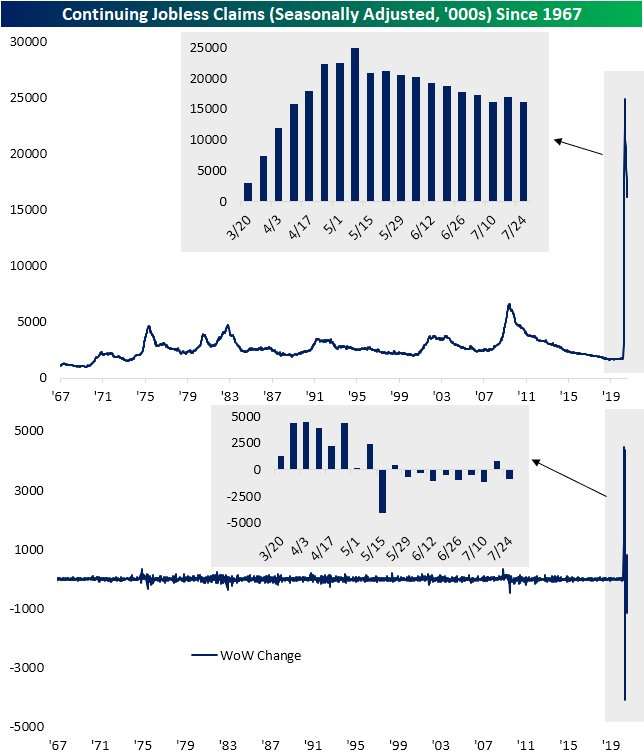
Whereas in recent weeks the addition of Pandemic Unemployment Assitance claims have made the overall picture look better or worse, this week the story matches up with the headline number. The number of PUA claims filed fell by more than a quarter WoW coming in at 655.7K. That is the lowest amount since tracking first began back in mid-April. While they are lagged an additional week and likely will not echo that improvement for another couple of weeks, continuing claims including PUA claims continued to hover around 30 million for the most recent week of data (the week of July 17th). All in all, seasonality aside, it was a very strong week for jobless claims. Click here to view Bespoke’s premium membership options for our best research available.

Bespoke’s Morning Lineup – 8/6/20 – Big Drop in Claims
See what’s driving market performance around the world in today’s Morning Lineup. Bespoke’s Morning Lineup is the best way to start your trading day. Read it now by starting a two-week free trial to Bespoke Premium. CLICK HERE to learn more and start your free trial.
Quote of the Day: “Investing should be more like watching paint dry or watching grass grow. If you want excitement, take $800 and go to Las Vegas.” – Paul Samuelson
Tell the above to the new breed of vintage 2020 traders. They want action and they want it now. Many of them would also probably gladly take $800 and go to Vegas or bet on sports instead, except they can’t! Futures have rallied off their recent lows following a strong read on initial and continuing jobless claims. Initial claims fell to their lowest levels since March (1.186 million) while continuing claims hit their lowest levels since April. Earnings remain the primary driver of stock action this morning both in Europe and the US and for today at least, the results and the stock price reactions haven’t been all that great. Lastly, headlines regarding any potential agreement (or disagreement) on a stimulus bill out of Washington will also cause back and forth swings.
Be sure to check out today’s Morning Lineup for a rundown of the latest stock-specific news of note, key earnings and economic news in Europe and the US, trends related to the COVID-19 outbreak, and much more.
The S&P 500 has now rallied 49% from its closing low on March 23rd, which is an exceptional rally by any standard. So, where does that leave us now, and how extended is the market? One way to measure this on a long-term basis is to compare the S&P 500’s price versus its 200-day moving average. Through yesterday’s close, the S&P 500 was 9% above its 200-DMA compared to a long term average of 2.4%. By this measure, the S&P 500 is more ‘extended’ than normal, but not really near extremes. Throughout history, the S&P 500 has been further above its 200-DMA on 22% of all trading days. More recently, in the last five years, we have also seen plenty of prior occurrences where the S&P 500 was at more extreme levels.
