B.I.G. Tips – Retail Sales Growth Slows But Still Positive
With the weekly $600 UI benefits expiring during the summer, consumer spending took a hit in August as Retail Sales showed slower than expected growth. At the headline level, Retail Sales grew 0.6% compared to forecasts for growth of 1.0%. Ex Autos and Ex Autos and Gas, growth came in slightly better at 0.7% but still shy of forecasts. In addition to the weaker than expected August reading, July’s sales were also revised lower from 1.2% down to 0.9%. While Retail Sales still showed growth, the report was underwhelming on just about all fronts.
While the level of growth was weaker than forecast, breadth within this month’s report was once again positive as nine out of thirteen different sectors saw m/m gains. The big leader by far was Bars and Restaurants which grew 4.7%, followed by Clothing, Furniture, and Building Materials which all saw month-over-month gains of over 2%. On the downside, Sporting Goods and Food and Beverage Stores both saw sales contract over 1%. Based on these moves, we’re still seeing a continuation of the trend of Americans returning to their prior spending habits before the onset of COVID.

While the monthly pace of retail sales is back at all-time highs, the characteristics behind the total level of sales have changed markedly in the post COVID world. In our just-released B.I.G. Tips report, we looked at these changing dynamics to highlight the groups that have been the biggest winners and losers from the shifts. For anyone with more than a passing interest in how the COVID outbreak is impacting the economy, our monthly update on retail sales is a must-read. To see the report, sign up for a monthly Bespoke Premium membership now!
Homebuilder Sentiment Soars
Homebuilders had nothing to complain about in recent months, as the National Association of Homebuilders (NAHB) sentiment index was already tied for its best levels on record. Today’s release of the September update surpassed all expectations. While economists were forecasting the headline index to come in at a level of 78, the actual reading was five points higher at 83. Never before has the homebuilder sentiment index topped 80, let alone moved as high as 83. If this sentiment survey was a stock chart, technicians would consider it a textbook breakout.
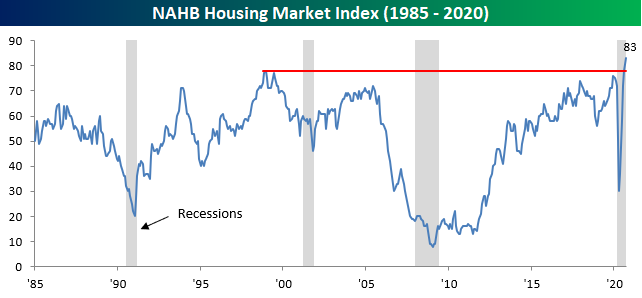
The internals of this month’s report were also very strong. Both Present and Future sales as well as Traffic all surged to record highs, and on a regional basis, every region except the West increased. The decline in the West likely stems from the fires in California, but even with that decline, all four regions are now comfortably back above their pre-COVID levels. Click here to start a free trial to Bespoke to unlock full access to all of our research and interactive tools.


Bespoke’s Morning Lineup – 9/16/20 – Fed on Deck
See what’s driving market performance around the world in today’s Morning Lineup. Bespoke’s Morning Lineup is the best way to start your trading day. Read it now by starting a two-week free trial to Bespoke Premium. CLICK HERE to learn more and start your free trial.
“The first one gets the oyster, the second gets the shell.” – Andrew Carnegie
US markets are looking to make it four days in a row of gains, but we still have to get through the FOMC later today. We just got the release of August Retail Sales, and the headline number came in weaker than forecasts (+0.6% vs 1.0%) as the impact of expiring $600 UI benefits works its way into the system.
Be sure to check out today’s Morning Lineup for a rundown of the latest stock-specific news of note, market performance in the US and Europe, trends related to the COVID-19 outbreak, and much more.

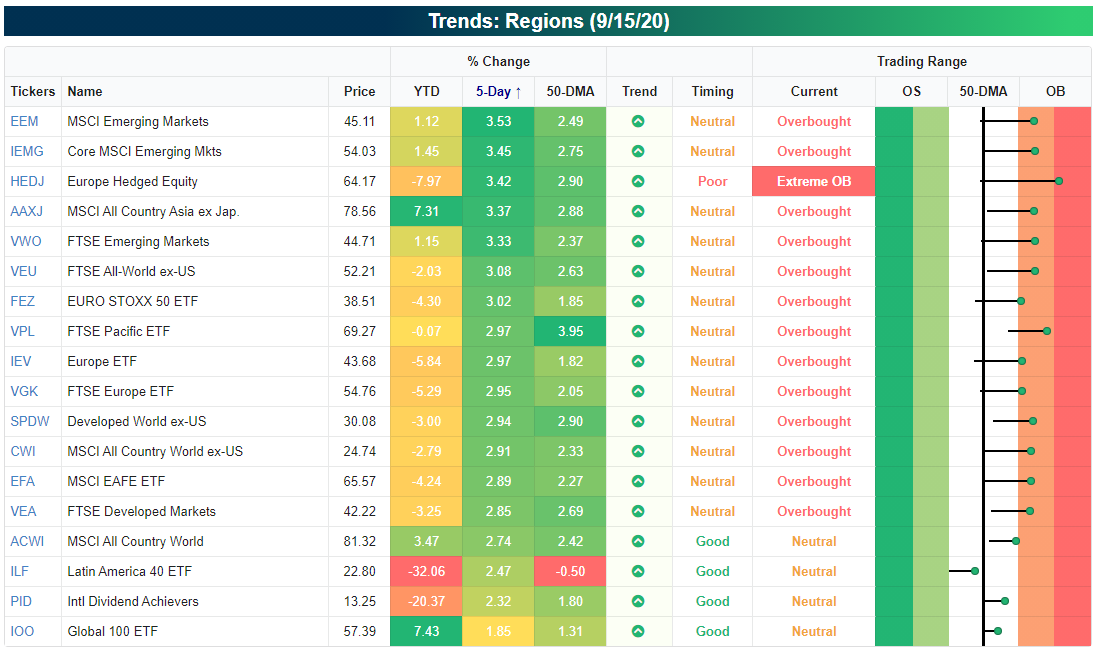
The snapshot below is from our Trend Analyzer screen of international regional ETFs. Looking through the various ETFs listed, you may be asking yourself, what correction? Of the nearly 20 ETFs listed, all but one is up over 2% in the last five trading days, and all but four are at overbought levels. The only ETF currently not above its 50-DMA is Latin America (ILF).
Daily Sector Snapshot — 9/15/20
B.I.G. Tips – Years Like 2020: Fall Edition
The Lights are on North of Broadway
New York City may still be closed for the most part, and the lights are still out on Broadway, but factories across the state are open for business. In the latest release of the Empire Manufacturing report for the New York region, the headline index of general business conditions rose from 3.7 up to 17.0 which was a full ten points above consensus forecasts. What’s very encouraging about these readings is that in the case of both current conditions and expectations, the levels for September are higher now than they were pre-COVID. Despite concerns that the running off of Federal relief programs was going to cause a sharp slowdown in activity, that hasn’t shown up in the Empire Manufacturing report as of yet.

In the early days of the COVID pandemic, manufacturers’ sentiment for present conditions dropped much more than their expectations for the future. In April, the spread between Expectations and Current Conditions was as wide as it has ever been. As businesses have come back online, though, things have moved back into a more normal range. In fact, the current spread of 30.60 is pretty much right in line with its historical average (30.1). That’s a great indication of how quickly certain parts of the economy have been able to adjust and adapt to the new reality.

Breadth in this month’s report was also fantastic. Every component of the Current Conditions part of the report improved relative to August, and just two of the components in the Expectations part (Delivery Times and Prices Received) declined. The biggest improvement came in the Average Workweek, while Number of Employees saw the smallest increase. That suggests that rather than hiring new workers, employers are getting more out of their current workforces. Not necessarily great for the jobs outlook.

Plans for Capital Expenditures and Technology Spending also increased in September. After dropping to their lowest levels since the Financial Crisis earlier this year, the rebound in both indices has been nearly as swift as the pullback. While current levels are still below where they were pre-COVID, the pace of recovery has never been sharper. The economy may still be far from normal, but things have bounced back a lot faster than many were thinking a few months ago. Click here to start a free trial to Bespoke to unlock full access to all of our research and interactive tools.

The US Now Exports More Energy Than It Imports
Yesterday the Energy Information Agency released their monthly snapshot of energy markets data for the United States. Much of the data is somewhat lagged; the data discussed in this post is only updated through May.
Our first chart highlights the huge shift away from coal and towards natural gas as an energy source, driven by both regulation and the economics of fracking. Also notable is the growth of wind and solar energy; solar especially is having an incredible year as production has risen an astounding 140% annualized in 2020.
The other recent shift in the domestic energy market is the COVID-driven plunge in petroleum share of total energy output. In April, petroleum fell below one-third of total US energy consumption as driving activity plunged. Obviously, this is very short-term and will rebound, but the growth of renewables and natural gas amidst the decline of coal will continue, unlike shorter-term trends like the highest share of nuclear power consumption on record.

We also wanted to highlight the energy trade balance. Historically, the US has imported vastly more energy than it has produced, but the massive expansion of domestic oil and natural gas production has reversed that precedent entirely.
As shown below, the US went from importing 2.5 trillion more BTUs of energy than it produced back in 2006 to exporting more energy than it imports beginning in August of last year. “Energy independence” isn’t a realistic or helpful goal, because large gross trade flows can increase efficiency, but on a net basis, the US has now been energy independent for about a year. This post was originally published in our post-market macro report — The Closer — on 9/14/20. Click here to start a free trial to Bespoke Institutional and receive our nightly Closer for the next two weeks, featuring more commentary and data on macro markets.

Lumber Squeezed, But Savings Super A Few Months Out
Today is the last day of trading for the September 2020 lumber future. Unlike the constant front-month, which now references November delivery futures, September lumber settled at $984.50 yesterday. The physical lumber market remains extremely tight, fueled by booming demand from construction, COVID’s impact on production eating into inventories, and now the forest fires in the West. Buyers who can wait a couple of months for delivery save 32% off the price of the current front-month contract; going out to next May that number is an impressive 48%; the futures market is pushing off construction into later quarters via price. Click here to start a free trial to Bespoke Institutional and receive our nightly Closer for the next two weeks, featuring more commentary and data on macro markets.
