S&P 500 Inductees: Class of 2020
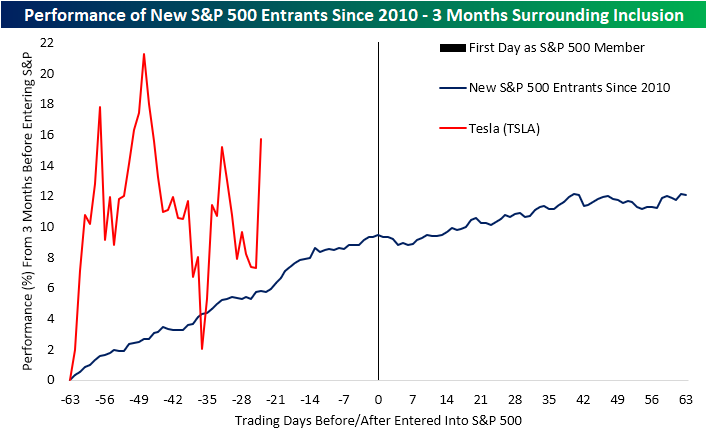
With Tesla (TSLA) set to be the next stock to join the S&P 500 in a little over a month, it will be the 20th change to the index (addition or removal of a stock) of 2020. That is basically in line with the average number of changes per year over the past decade (20.7). Of the current members of the S&P 500, 191 have entered the index since the start of 2010.
Below we show a chart from last night’s Closer depicting the performance of the stocks that have entered the S&P 500 in the past decade beginning three months before their entrance date (day number zero is the first day as an S&P 500 member) to three months after. As shown, historically over the past decade, new entrants to the large-cap benchmark have on average risen in the months leading up to inclusion. In the immediate days following inclusion, there is some sideways to slight downward movement but that is followed by a turn higher.
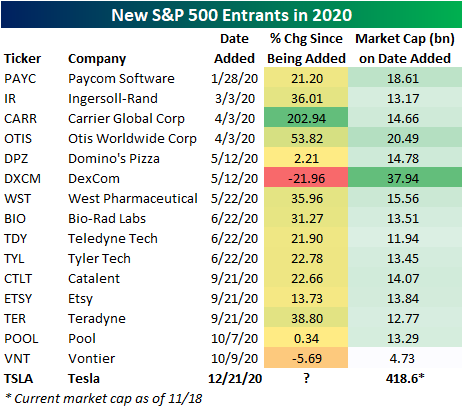
In the chart below we show the performance of just the stocks that have been included in the index since the start of 2020 from the close before the first day they trade as an S&P 500 stock through three months out. While it has not been a full three months since some of these have been added (i.e. Teradyne (TER), Catalent (CTLT), Etsy (ETSY), Pool Corp (POOL), and Vontier (VNT)), the average performance three months after inclusion has been a gain of 11.5%. Carrier Global (CARR), which was spun off of United Technologies (UTX) in the spring, experienced the largest move higher following its inclusion with a rally of 82.3%. TER is on pace for the second-largest gain having risen 39.04% since joining back in September. On the other hand, Paycom (PAYC) fell 24.27% after joining the S&P; the worst of any of these stocks.
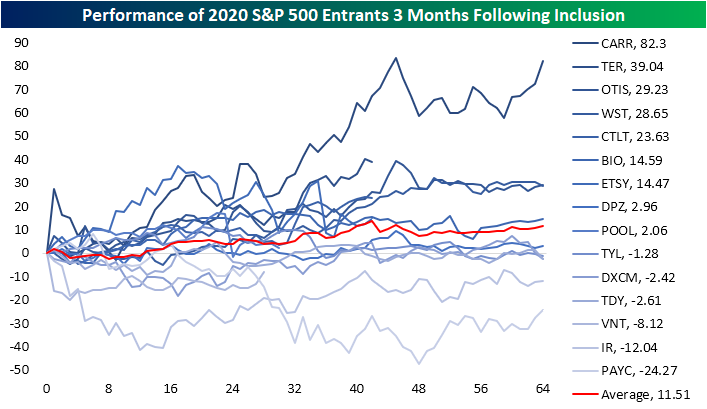
Paycom’s decline in the three months following its inclusion was largely a function of very poor timing though. The stock was added to the index in late January, meaning that 3 month period essentially covered the whole of the COVID Crash in February and March. Since its inclusion, though, it has rallied 21.2%. That is roughly 1.5 percentage points lower than the median performance to date of all 2020 additions since being added to the index. Dexcom (DXCM) and the newest addition Vontier (VNT) are the only stocks to currently sit below their levels from prior to addition.
As for what this means for Tesla (TSLA) in the months to come, recent history has shown new additions to the index have been treated well by investors, but TSLA has one major distinguishing feature: its size. As shown below, TSLA’s current market cap is $418.6 billion. By comparison of other additions in 2020, on the respective date it was added to the index, DexCom (DXCM) was the largest with a $37.94 billion market cap. That is 11 times smaller than TSLA today. By that same rate, the largest stock in terms of current market cap is Carrier (CARR) at $34.98 billion. With respect to CARR, TSLA is 12 times its size even after CARR’s stock price has tripled since being included into the S&P! Click here to view Bespoke’s premium membership options for our best research available.
Bespoke’s Morning Lineup – 11/18/20 – More Good Vaccine News and Strong Starts
See what’s driving market performance around the world in today’s Morning Lineup. Bespoke’s Morning Lineup is the best way to start your trading day. Read it now by starting a two-week free trial to Bespoke Premium. CLICK HERE to learn more and start your free trial.
“If the only tool you have is a hammer, you tend to see every problem as a nail.“ – Abraham Maslow
What was looking like a negative session for equities late last night steadily improved overnight, and futures are firmly in positive territory as the open nears. Sentiment was already improving, but Pfizer’s (PFE) announcement that its vaccine was actually 95% effective instead of 90% helped the positive tone. Also, the latest data on Housing Starts and Building Permits was inline to modestly better than expected.
Be sure to check out today’s Morning Lineup for a rundown of the latest stock-specific news of note, European economic data, trends related to the COVID-19 outbreak, and much more.

The big news outside of equities this morning is in cryptocurrencies as bitcoin’s price topped $18K for the first time since late 2017. After breaking out of its uptrending channel a few weeks back, bitcoin hasn’t looked back.

From a long-term perspective, bitcoin is now just $600 from its record high closing price, which would set the stage for a pretty textbook breakout if it occurs.

Given its attractiveness as a store of value, we like to compare bitcoin’s price to the price of gold. The last time bitcoin’s price was this high, gold was considerably lower, so one bitcoin would buy close to 15 ounces of gold. Today, the ratio is considerably lower at just under 10 ounces. So, there’s a way to go before the ratio gets back to record highs, but the recent move has taken the ratio back above its most recent peak in 2019.

Daily Sector Snapshot — 11/17/20
Chart of the Day – Strong Breadth Readings Versus the 200-DMA
Bespoke Stock Scores — 11/17/20
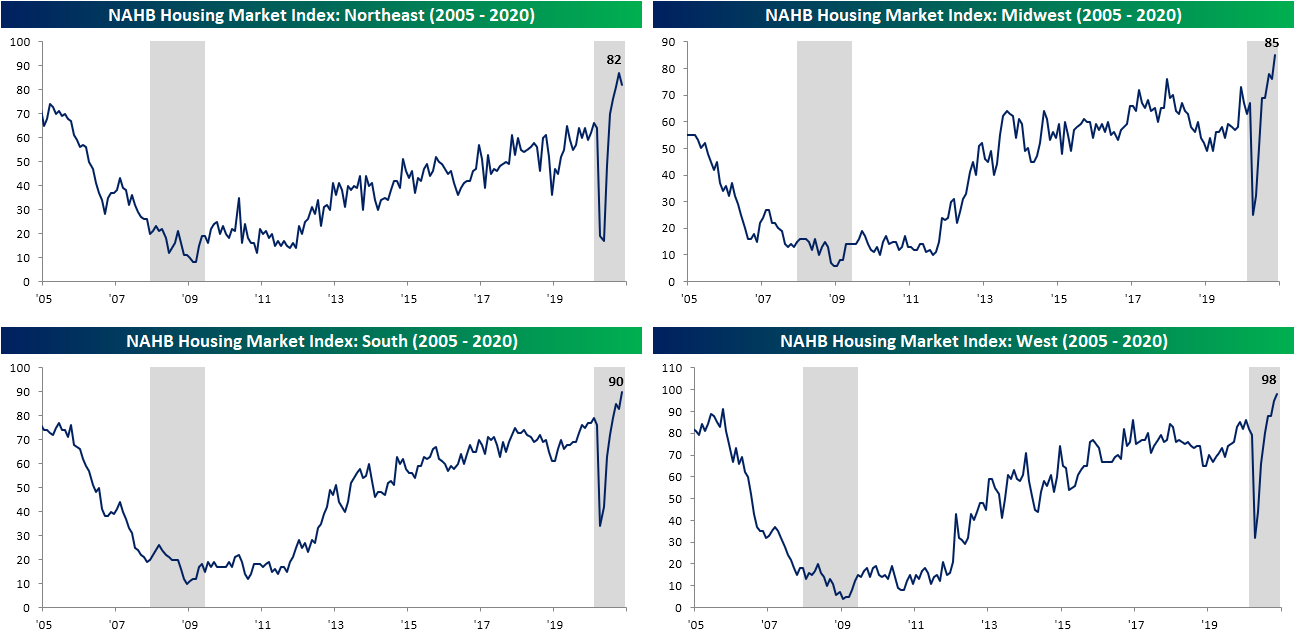
Never Been Better for Builders
It is hard to believe that housing-related indicators could continue to impress, but the NAHB’s reading on homebuilder sentiment released this morning did just that. The headline reading was expected to hold steady at what was a record high of 85. Instead, the index set the record high bar even higher as it rose 5 points to 90.

Not only does the index sit at an all-time high, but the 5-point move this month was in the top 10% of all month over month changes. The same can be said for the index for Present Sales as well as sentiment in the Midwest and the South. Overall, just about every sub-index of the report was higher this month and rising to new record highs. The Northeast was the only holdout as that index fell 5 points, but at 82 it is still at its second-highest level ever. With more records this month, every index has made a new record in at least two of the last three months. The headline index, Present Sales, and Future Sales have done so in back to back to back months.


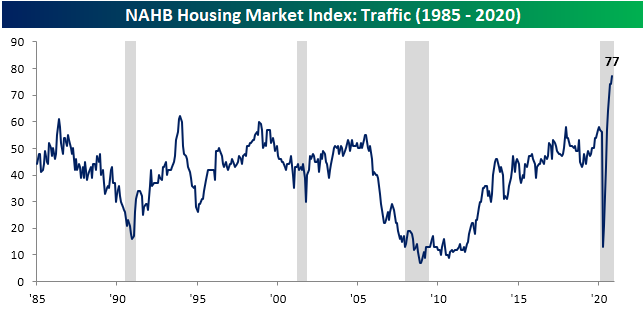
As previously mentioned, there has been strength in homebuilder sentiment across the country regardless of region. Even though the Northeast declined 5 points (a historically large month over month decline around the bottom 5% of MoM changes), it still sits well above anything observed throughout the history of the data. The same can be said for the Midwest, West, and South.
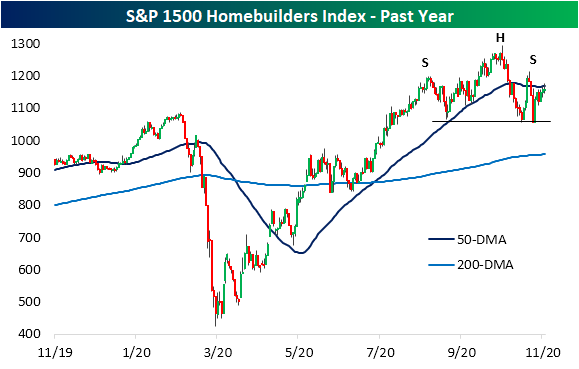
Even though homebuilder sentiment is strong, sentiment for the industry’s stocks has waned. The S&P 1500 Homebuilders group last put in a high roughly one month ago. In the days since then, it has been consolidating between support at the early September lows and its sideways trending 50-DMA. From a technical perspective, homebuilder stocks are at a bit of a crossroads as the price action of the past few months has set up what’s looking like a head and shoulders pattern. On the bright side, last week’s bounce that has carried into this week has not confirmed the completion of that pattern. But conversely, even with the catalyst of homebuilder sentiment today, the index has not been able to make a significant push back above its 50-DMA. When stocks stop rising on good news, it warrants attention. Click here to view Bespoke’s premium membership options for our best research available.
Long Term Averages Taken Out
With equities having another strong day yesterday, a large number of stocks closed above their 200-DMAs. For the S&P 500 as a whole, nearly 90% of the index closed above their long term moving averages. That was the highest percentage for the broad index since July 3rd, 2014. As equities pullback today, that reading is lower at 86.56% as of this writing which is still in the 90th percentile of readings since 1990.
As shown in the charts below, the same applies on a sector by sector basis as well. Consumer Discretionary, Consumer Staples, Financials, Industrials, and Materials all currently boast readings above 90%. For Consumer Discretionary, there have been a few similarly high readings since the start of the month, and these have all been the highest on record since at least 1990. For other sectors, recent readings have similarly been at multi-year highs. Levels for Communication Services, Health Care, and Materials, are all their highest since September or late August, but for others, it has been much longer since we saw similar readings. For example, the last time Industrials saw as high of a percentage of stocks above their 200-DMA was way back in May of 2013, and for Consumer Staples, the last higher reading was in October of 2013. The sector that has the weakest number of stocks above their 200-DMAs is unsurprisingly Energy. Whereas yesterday exactly half of the stocks in the Energy sector finished above their 200-DMA, today less than a third remain above that level. Granted, that is far better than the end of October when not even 5% were above.

In the table below, we show a list of the S&P 500 Energy sector’s components showing how far each is above/below their 200-day moving average as well as the MTD and YTD performance. Baker Hughes (BKR), Halliburton (HAL), and Marathon (MPC) are all the most elevated, currently above their 200-DMAs by double-digit percentages. TechnipFMC (FTI) and National Oilwell Varco (NOV) have been the top performers in the sector, but they both still sit a few percentage points below their 50-DMAs even after rallies of more than 40% this month. The only Energy sector stock to have fallen in what has been a remarkably strong month is Cabot Oil and Gas (COG), though it is one of the best performers YTD with a decline of just 2.4%. Still, its recent decline leaves it as one of the furthest below its 200-DMA. Click here to view Bespoke’s premium membership options for our best research available.

B.I.G. Tips – Retail Sales Slow
The October Retail Sales report missed expectations this morning on both a headline and core basis. In addition to the weaker than expected reading for October, September’s report was also revised lower.
Breadth in this month’s report was also negative for the first time since April. Of the thirteen sectors tracked in the report, just five showed growth while eight declined. On the positive side, Non-Store retail was the main bright spot with m/m growth of 3.11%. That’s the last thing every traditional retailer wants to hear and could be indicative of another wave of retrenchment on the part of consumers as the weather gets colder and case counts rise. Electronics and Appliances also reported strong sales growth likely aided by the launch of the iPhone 12. On the downside, Clothing and Sporting Goods both saw m/m declines of over 4%, while sales at General Merchandise retailers dropped 1.1%.

While the monthly pace of retail sales is back at all-time highs, the characteristics behind the total level of sales have changed markedly in the post COVID world. In our just-released B.I.G. Tips report, we looked at these changing dynamics to highlight the groups that have been the biggest winners and losers from the shifts. For anyone with more than a passing interest in how the COVID outbreak is impacting the economy, our monthly update on retail sales is a must-read. To see the report, sign up for a monthly Bespoke Premium membership now!
Bespoke’s Morning Lineup – 11/17/20 – A Good Year in Two Weeks
See what’s driving market performance around the world in today’s Morning Lineup. Bespoke’s Morning Lineup is the best way to start your trading day. Read it now by starting a two-week free trial to Bespoke Premium. CLICK HERE to learn more and start your free trial.
“There are decades where nothing happens; and there are weeks where decades happen” – Vladimir Ilyich Lenin
Futures are lower this morning after investors take profits following a torrid rally since the start of the month. Home Depot (HD) reported earnings this morning, and despite strong results, the stock sold off on the news, and that helped contribute to the weaker tone in futures. Walmart (WMT) also reported earnings, and that’s having a modestly positive reaction in the pre-market as earnings season winds to a close.
Earnings season may be winding down, but there’s plenty of other factors for investors to contend with today as there’s a busy slate of economic data, including Retail Sales, Import Prices, Industrial Production, Capacity Utilization, Business Inventories, and Home Builder Sentiment. If that’s not enough for you, there’s also plenty of Fedspeak to deal with as well
Be sure to check out today’s Morning Lineup for a rundown of the latest stock-specific news of note, Singapore trade data, trends related to the COVID-19 outbreak, and much more.
It’s been a strong month for the US equity market, but sometimes putting numbers on the totals helps to put it in perspective. Within the Russell 3000, which encompasses large, mid, and small caps stocks, the average performance of the stocks in the index this month is a gain of more than 15%. 15%! In most years, that’s considered a good year, and it’s only been eleven trading days!
In terms of sectors, Energy is leading the way as stocks in the sector are up an average of 24.6% followed by Communication Services, where the average performance of stocks in that sector has been a gain of just over 20%. Outside of those two sectors, Real Estate (19.6%), Industrials (18.4%), and Financials (16.1%) are the three only other sectors with average returns ahead of the Russell 3000. One sector notably absent from the list of outperformers is Technology. That sector normally tops the list during periods of market strength, but the average performance of stocks in that sector so far this month is 2.5 percentage points behind the market at 12.8%- not too shabby. With stocks in the Utilities sector averaging a gain of 9.7%, it’s at the back of the back, but it’s hard to consider that weak.
