Bespoke’s Morning Lineup – 9/29/25 – 1999 All Over Again?
See what’s driving market performance around the world in today’s Morning Lineup. Bespoke’s Morning Lineup is the best way to start your trading day. Read it now by starting a two-week trial to Bespoke Premium. CLICK HERE to learn more and start your trial.
“Never make anything more accurate than it needs to be.” – Enrico Fermi

Below is a snippet of commentary from today’s Morning Lineup. Start a two-week trial to Bespoke Premium to view the full report.
After last trading to record highs last Monday, US equities are kicking off the week on a positive note once again this week as deal-making activity provides a boost to investors concerned about market valuations. Both the S&P 500 and the Nasdaq are indicated to open up by over 0.50%. Crude oil is down over 2%, which also helps, while gold is up over 1% and Bitcoin and Ethereum are both up close to 2% after some rough trading last week.
The pace of earnings activity will be incredibly slow this week, with Nike (NKE) the only notable report of the week (Tuesday). Economic data will pick up the slack, though, with multiple PMI readings, Consumer Confidence, and Non-Farm Payrolls.
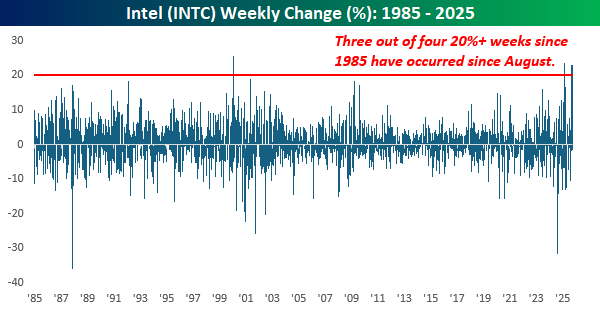
Like the S&P 500, which hit an all-time high last week before pulling back modestly, the Philadelphia Semiconductor Index (SOX) also hit an all-time high last Monday and then pulled back a little bit but still managed to finish the week up by 1.2%. What’s been interesting about the SOX this year, though, is which stocks are leading. A list of some of the index’s best performers this year looks like a time warp from the late 1990s, with stocks like Rambus (RMBS), Micron (MU), Lam Research (LRCX), and Intel (INTC) all up over 75%! INTC was up over 20% just last week! Meanwhile, Nvidia (NVDA), the leader of the AI revolution, has been in the middle of the pack, managing a gain this year of ‘only’ 33%.
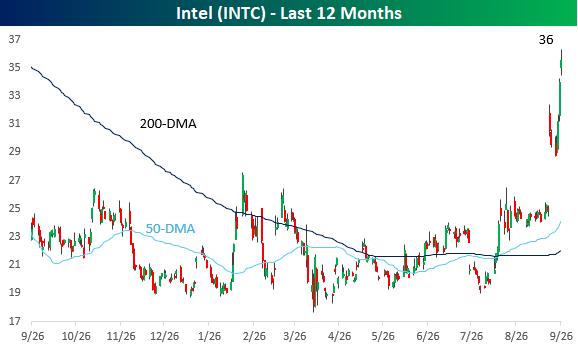
On a one-year basis, INTC’s chart looks a lot like ones from the 1990s as the stock has gone parabolic over the last two months, surging close to 90%!
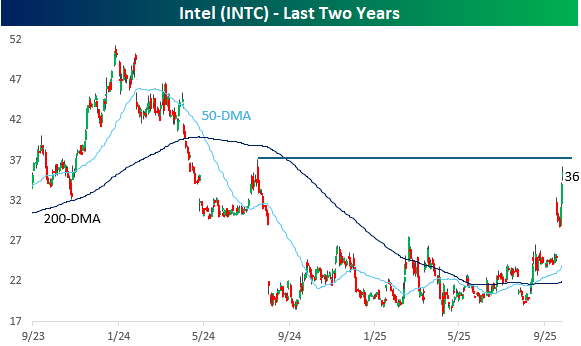
On a two-year basis, INTC’s move looks more modest. Last Friday’s surge topped out just shy of the high it reached in the summer of 2024 right before it plunged 50% in a matter of weeks!
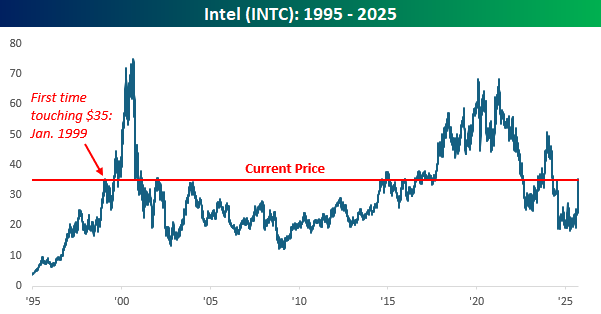
As impressive as INTC’s run has been in the last couple of months, it is still a shell of its former self. It’s still down close to 50% from its high in 2021. Additionally, while there has been a lot of talk lately about the market feeling like 1999, with INTC closing at $35 and change last Friday, it’s back to levels it first crossed back in January 1999!
Perhaps the most amazing thing about the recent moves in INTC is that last week’s gain of 20% was the third week in the last seven that the stock rallied 20%+. How crazy is that? Since 1985, there has only been one other week outside of the last seven that the stock rallied 20%+.
Brunch Reads – 9/28/25
Welcome to Bespoke Brunch Reads — a linkfest of some of our favorite articles over the past week. The links are mostly market-related, but there are some other interesting subjects covered as well. We hope you enjoy the food for thought as a supplement to the research we provide you during the week.
Fourth Time’s A Charm: On September 28, 2008, a slender rocket named Falcon 1 rose from the remote Kwajalein Atoll in the Pacific and carved SpaceX into aerospace history. It was the company’s fourth attempt to prove it could pull it off, after three consecutive failures. SpaceX had just enough money and parts for this final shot, and a failure could have ended the company before it truly began. When the rocket cleared the atmosphere and delivered its payload into orbit, Falcon 1 became the first privately developed, liquid-fueled rocket to reach space. The moment validated not just the engineering team’s relentless work but also Musk’s insistence that a startup could challenge an industry long dominated by governments and defense contractors. Within weeks, NASA awarded the company a major contract for cargo resupply to the International Space Station, giving SpaceX a lifeline and a mandate. From that improbable success in 2008, SpaceX would scale up, build Falcon 9, and ultimately redefine the economics of spaceflight.

AI & Technology
America’s top companies keep talking about AI — but can’t explain the upsides (Financial Times)
Big companies talk up AI, but their own filings show fuzzy payoffs: 374 S&P 500 firms mentioned AI on earnings calls, and most were upbeat, while risk sections stress cyber attacks, legal fights, and projects that don’t work. Clear wins cluster around the data-center boom and back-office chores, boosting power suppliers, miners, and equipment makers, while some consumer brands point to things like making TV ads. A recent study finds that most workplace pilots fail, and many 10-Ks warn that AI may not lift profits at all. [Link]
Continue reading our weekly Brunch Reads linkfest by logging in if you’re already a member or signing up for a trial to one of our two membership levels shown below! You can cancel at any time.

Q3 2025 Earnings Conference Call Recaps: Costco (COST)
Bespoke’s Conference Call Recaps use AI to summarize lengthy earnings calls. The commentary below is AI-generated and then edited by Bespoke for quality control. As always, none of these summaries should be construed as recommendations to buy or sell any securities, and investors should do their own research and/or consult with a financial professional before making any investment decisions.
Our latest recap available to Bespoke subscribers covers Costco’s (COST) Q4 2025 earnings call.
![]()
Costco (COST) is a membership-based warehouse retailer selling a limited, high-turn assortment of essentials and “treasure-hunt” discretionary items under national brands and its Kirkland Signature (KS) label. It operates 914 warehouses worldwide, plus growing e-commerce and last-mile channels, serving households and small businesses seeking quality and value. What’s impressive is the company’s cult-like loyalty (92.3% US/Canada renewal). Because Costco buys in bulk and keeps prices tight, it’s a good read on what shoppers want, where costs are rising (food, labor, tariffs), and how global sourcing is changing. Beyond groceries, it also sells travel, has pharmacies/optical, big gas volumes, and is starting to make ad dollars from its website. It’s still opening stores in the US and overseas, and expanding Business Centers for small businesses. Comparable sales rose 5.7% (6.4% ex-gas/FX) and e-commerce +13.6%. Membership fees hit $1.72B and paid members reached 81M, with executive members totalling 38.7M (74% of sales). Longer hours added about 1% to weekly US sales, and faster checkout and lower spoilage helped offset wage hikes. To handle tariffs, Costco is moving suppliers and leaning into Kirkland. Digital upgrades included passwordless sign-in, anti-bot “waiting rooms,” and tracking “digitally enabled” sales. Despite EPS and sales beats, COST shares declined more than 2.5% on 9/26…
Continue reading our Conference Call Recap for COST by becoming a Bespoke Institutional subscriber. You can sign up for Bespoke Institutional now and receive a 14-day trial to read our newest Conference Call Recap. To sign up, choose either the monthly or annual checkout link below:
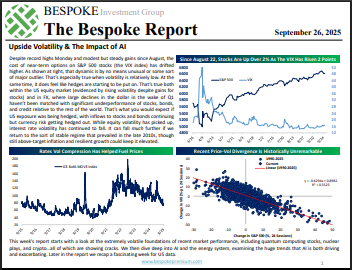
The Bespoke Report – 9/26/25 – Upside Volatility & The Impact of AI
To read our weekly Bespoke Report newsletter and access everything else Bespoke’s research platform offers, start a two-week trial to Bespoke Premium. This week we are focused on two themes: the increasingly volatile foundations of the stock market rally and the circular AI boom along with its impacts on valuations, the energy system, and economic growth. We also review a series of key economic data this week that should ease many fears of slowing consumer spendingas well as inflation data and the week that was in global asset markets. Give it a read!

Daily Sector Snapshot — 9/26/25
Bespoke Stock Profile: Symbotic (SYM)
Home Sale Strength
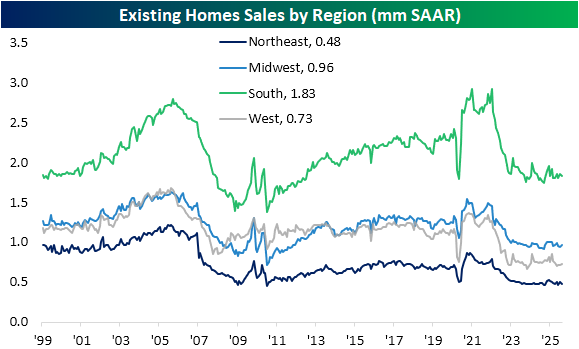
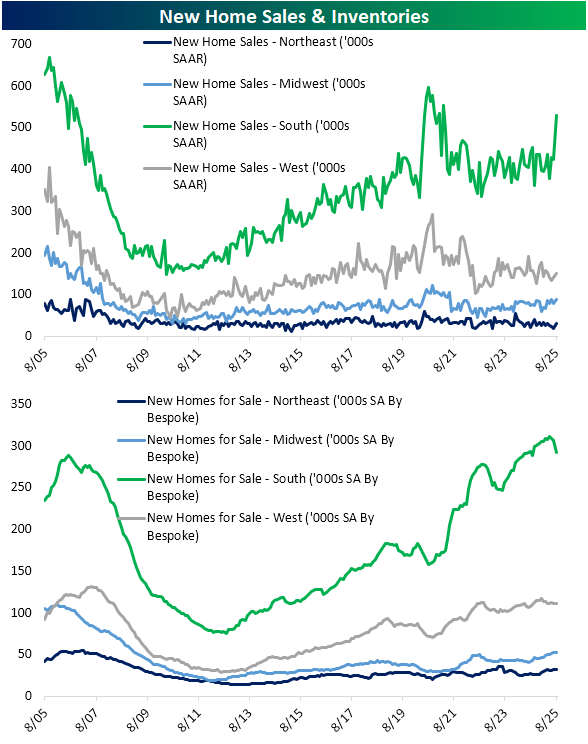
It was an eventful week for housing data as New Home Sales were released on Wednesday and Existing Home Sales came out yesterday. Working in reverse order, Existing Home Sales came in ahead of forecasts on a national level, although the sales pace has remained sluggish relative to pre-pandemic or early post-pandemic levels. As shown below, on a regional basis, sales are strongest in the South by a solid margin, although that is historically normal. Current levels are hovering around the lows from the spring of 2020 and the same applies to the West and Northeast. As for the Midwest, sales are well below those lows.
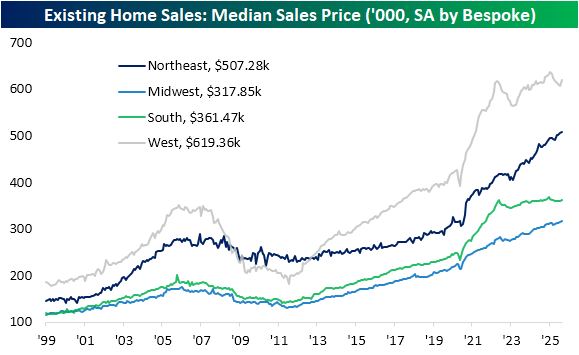
Turning over to prices, trends have a bit more variation. Prices are highest in the West and that has been the case for over a decade now. With that said, the past few years since higher rates came into play have seen far less steady gains compared to the exponential move higher from 2020 to 2022. Likewise, the South has seen prices flatline in the past few years amid higher inventories. The Midwest and Northeast are entirely different stories. The torrid price gains of the early pandemic years have continued for those two regions with only a minor dip occurring in late 2022/early 2023.
Turning over to New Home Sales data updated on Wednesday, there was a very strong print on a national scale, surging 20% MoM versus estimates of a small decline. The huge beat was driven by strong sales in completed homes, although sale of homes under construction also surged. Geographically, that strength was broad with all regions ticking up during the month of August. While accounting for the smallest share of total homes, sales in the Northeast were up an impressive 72% MoM and sales in the South (the largest share of national sales and inventories) jumped by 24.7%. As shown in the second chart below, new homes for sale (inventories) have fallen meaningfully after the latest surge in sales in the South. Meanwhile, the Midwest now has some of the highest inventories for new homes since February 2009.

Matrix of Economic Indicators – 9/26/25
Our Matrix of Economic Indicators provides a concise summary analysis of the US economy’s momentum. We combine trends across the dozens and dozens of economic indicators in various categories like manufacturing, employment, housing, the consumer, and inflation to provide a directional overview of the economy.
To access our newest Matrix of Economic Indicators, start a two-week free trial to either Bespoke Premium or Bespoke Institutional now!
Price and 10-Day A/D Line Divergence
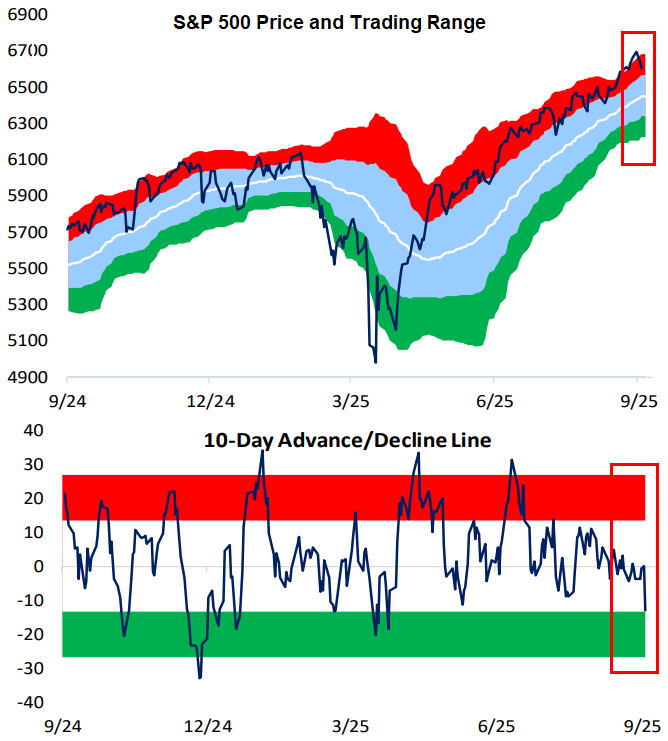
While the S&P 500 remains overbought in price (>1 standard deviation above its 50-DMA), its 10-day advance/decline line actually moved near oversold territory yesterday. The 10-day A/D line measures the average number of daily advancers minus decliners in an index over the last ten trading days. It’s a helpful measure of short-term market breadth. When the 10-day gets overbought, it’s a sign that stocks have had a large upward thrust over the last two weeks, often preceding some downside mean reversion. The opposite is also the case: when the 10-day gets oversold, it’s a sign that stocks within an index have struggled in the short-term, and thus upside mean reversion may be in store.
Usually, an index’s price and its 10-day track each other, but for the top-heavy S&P, there can be divergences because of how large the mega-caps have become. Because the mega-caps have held up well over the last two weeks, it has masked underlying weakness in the majority of stocks.
From a mean reversion perspective, the oversold 10-day suggests that the average stock could be in store for a bounce, while the mega-caps causing the S&P’s price to remain overbought could take a breather.
Bespoke subscribers can monitor the 10-day A/D line and other measures of breadth in our daily Sector Snapshot. If you’d like to check it out, start a trial to Bespoke Premium today.
Bespoke’s Morning Lineup – 9/26/25 – Wistful for Monday
See what’s driving market performance around the world in today’s Morning Lineup. Bespoke’s Morning Lineup is the best way to start your trading day. Read it now by starting a two-week trial to Bespoke Premium. CLICK HERE to learn more and start your trial.
“This is the way the world ends, not with a bang but a whimper.” – T.S. Eliot
Below is a snippet of commentary from today’s Morning Lineup. Start a two-week trial to Bespoke Premium to view the full report.
Futures were higher heading into this morning’s economic data, and after the 8:30 batch of data, equities have built modestly on their gains. Personal Income and Personal Spending were both a tenth higher than expected, and PCE inflation was in line with forecasts at both the headline and core levels. While the inflation data was right inline, it remains at uncomfortably high levels with y/y headline coming in at 2.7% while the core reading was 2.9%. As long as these readings can stay below 3%, markets should be able to handle it.
Mondays aren’t usually a day we look forward to, but looking back, it’s been the best day of the week. After riding the optimism of Fed rate cuts to record highs last week, investors took the weekend to think about it and liked what they saw. On Monday, the S&P 500 rallied for the third day in a row, hitting its eighth record high of the month and the 28th record high of the year.
Since that record high on Monday, however, the S&P 500 has traded down for three straight days and is now trading back to where it closed last Tuesday – before the Fed cut rates. Instead of optimism for lower rates, investors are increasingly worried that the market is getting ahead of itself as terms like euphoria and bubble enter the lexicon.
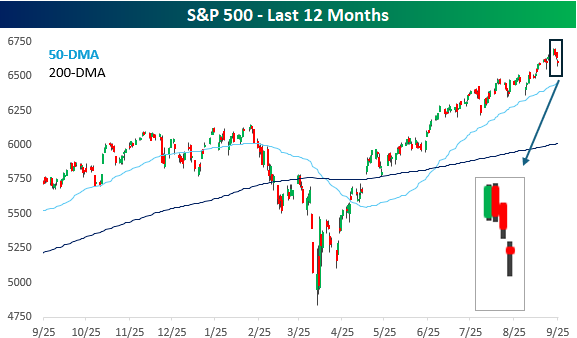
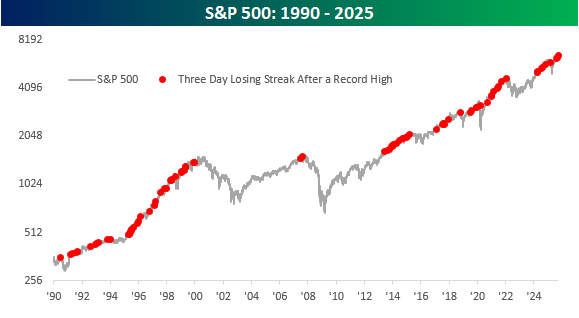
The severity of the declines this week has been extremely modest. Over the course of the three-day losing streak, the S&P 500 is down less than 1%, so if this type of ‘pullback’ makes you nervous, you’re taking too much risk. Besides the shallow nature of the decline, the fact that the S&P 500 is down three days in a row after hitting a record high is hardly unusual. The chart below shows the S&P 500 dating back to 1990, and the red dots show every three-day losing streak that followed a record closing high. Just this year, there have been three other occurrences. One occurred back in February ahead of the tariff-tantrum, but there was also another one in late July and then again in mid-August. Remember those? We didn’t either.
Looking at other occurrences, yes, similar scenarios have played out right around major market tops, but there were dozens more that no one remembers anymore. The only way we’ll know if this occurrence is a significant one is with hindsight, but the odds are that it’s not.