The Bespoke Report – Slip But No Slide (Yet)
This week’s Bespoke Report newsletter is now available for members.
For a lot of kids (and some adults) one of their favorite outdoor activities is the ‘slip and slide’, especially the homemade ones made from large plastic tarps. There’s nothing like turning on the hose on a hot summer day and running headfirst down a long plastic sheet covered with cold water to cool off. Looking at the market this week, we saw some signs that it was starting to slip, but hopefully, at this point, it doesn’t turn into a slide.
The S&P 500 started off the week with its 39th record high of the year, which already ranks as the 12th most for a given year since WWII. The next four days weren’t nearly as positive, though, as the S&P 500 declined in three out of the four next days while the Nasdaq and Russell 2000 both headed into the weekend riding four-day losing streaks.
Where to from here? As always, there’s a number of positives and negatives within the market, and in this week’s Bespoke Report we cover a wide range of them. To read the report and access everything else Bespoke’s research platform has to offer, start a two-week free trial to one of our three membership levels.


Seasonal Summer Slump
Taking a look at our Seasonality Tool, it is hard to find a day in the year that will give a weaker reading for the one month to three month periods. As shown in the snapshot of the tool below, over the past decade, the one month period from mid-July has a median loss of 0.34%. That stands in the 13th percentile of all periods of the year. Meanwhile, three month performance ranks even weaker in the bottom 2% of all periods with a median decline of 1.19%.

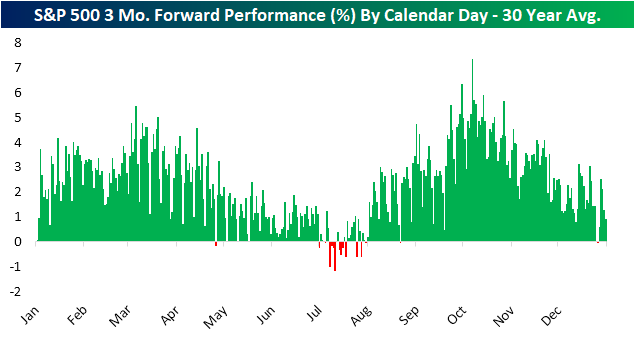
To show this in another light, in the chart below we show the average 3 month forward performance over the past 30 years for each calendar day of the year. July is the only major period of the year in which the forward 3-month performance consistently leans negative.
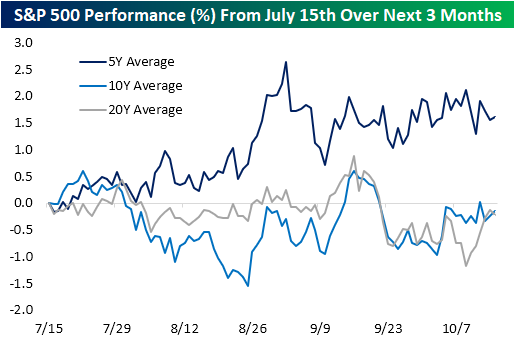
While over the long term mid-July and the next few months have been one of the weaker periods of the year, more recently things have been a bit better. In the chart below, we show the S&P 500’s average performance from July 15th out over the next three months. While the 10 and 20-year averages show the S&P 500 is typically flat or slightly lower through the summer and early fall, the index has actually on average trended higher over the past five years. In other words, that seasonal weakness has been less evident in recent years. Click here to view Bespoke’s premium membership options.
B.I.G. Tips – Historic Small-Cap Underperformance
Bespoke’s Morning Lineup – 7/16/21 – Nine Would Be Fine
See what’s driving market performance around the world in today’s Morning Lineup. Bespoke’s Morning Lineup is the best way to start your trading day. Read it now by starting a two-week free trial to Bespoke Premium. CLICK HERE to learn more and start your free trial.
“The first principle is that you must not fool yourself, and you are the easier person to fool.” – Richard Feynman
Futures are higher this morning ahead of Retail Sales, Business Inventories, and a preliminary read on Michigan Confidence. On the Retail Sales front, both the headline and ex Autos readings came in significantly ahead of forecasts.
Summer Fridays are typically slow, but one area of excitement will be the Nasdaq 100 where the index needs to close about 35 points higher today in order to extend its current weekly winning streak to nine. Based on where futures are currently trading, the index should be in the green for the week to start the trading day, but where it finishes will be more important. Whether the streak ends at eight or extends to nine, though, it would still be the longest weekly winning streak for the index since the first half of 2019.
Read today’s Morning Lineup for a recap of all the major market news and events from around the world, economic data out of Asia and Europe, the latest US and international COVID trends including our vaccination trackers, and much more.

The picture for the three major indices shows vastly different pictures depending on which index you look at. Starting with the Russell 2000, it has been a major laggard and yesterday was on pace to close more than 1.5% lower for the third consecutive day, but a late-day bounce erased more than two-thirds of the decline. As weak as the Russell has been lately, the longer-term chart is far from breaking down as it remains stuck in a range after surging in late 2020 and into early 2021.
For large-cap stocks, the picture looks much different. Both the Nasdaq 100 and S&P 500 hit record highs earlier this week but have been wobbling in the last few days. While the Russell 2000 trades in oversold territory, the large-cap indices remain overbought so they could be susceptible to some more consolidation in the days and weeks ahead.

Empire Fed Shatters Expectations
Of the array of economic data released this morning, perhaps the most impressive was the New York Fed’s reading on the manufacturing sector. The headline index came in at 43, smashing estimates by 25 points. As we show below, that was one of the strongest readings relative to expectations since 2002 with the only bigger beat being last June. Not only was it impressive relative to expectations, but the release also set a record high. In addition to the July reading being a record high, the month-over-month change was the fourth largest on record behind May and June of last year and May of 2003.
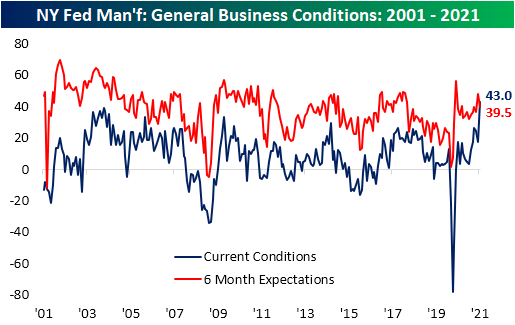

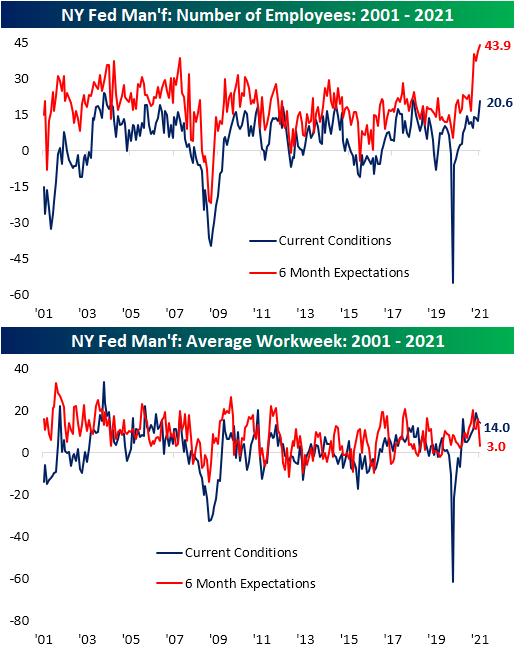
Driving the surge in the headline number were big improvements across categories, but especially for New Orders, Shipments, and Inventories. The MoM increases for each of those categories ranked in the top 5% of all months and left them at some of the highest readings on record. While most categories improved versus June, there were three outliers: Delivery Time, Prices Paid, and Average Workweek.

Demand-related indices were some of the most impressive areas of the report. New Orders surged 16.9 points to 33.2 which was the highest level since 2004. That massive acceleration in orders growth meant backlogs grew at a more rapid pace as Unfilled Orders rose 4.2 points. Even though that is a historically strong level, it was 9.3 points below the even more elevated readings from earlier in the spring. Fortunately, manufacturers appear at least somewhat more capable of fulfilling those orders. Shipments surged to 43.8 which, like new orders, was the highest level in the index since 2004. Additionally, inventories grew at a rapid rate. The Inventories Index rose 18.8 points from a contractionary reading last month to one of the highest levels on record.

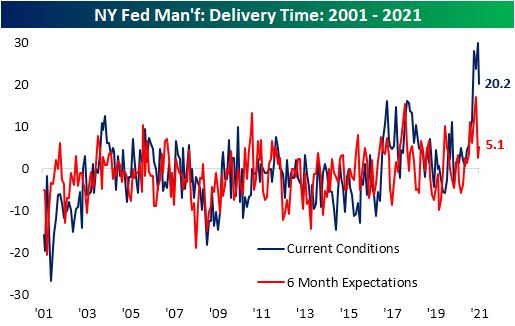
One likely reason for the massive increase in inventories and shipments is some normalization in supply chains. The index for Delivery Times measures how long it takes for supplier products to arrive. Higher readings indicate longer lead times and vice versa. Over the past year, these indices have surged to unprecedented levels across regional Fed and other manufacturing reported. While the Empire Fed’s reading is still extremely elevated from a historical context, the 9.6 point drop month over month marked a significant improvement in lead times.
Input price pressures have also subsided a bit. Similar to the Delivery Times index, the index for Prices Paid is extremely elevated but showed some relief in July. That was not the case for Prices Received though. That index continued to rise with both the current conditions and 6-month expectation indices reaching record highs in July.

In terms of the expectations indices, the only other one to reach a record in June was for the Number of Employees. The increase in that index was matched by a sizeable uptick in the current conditions index as well. That index rose 8.8 points to the highest level since June 2018 indicating the region’s manufacturers continue to have a strong appetite for labor and are in fact taking on more workers. Click here to view Bespoke’s premium membership options.
Fewer Bulls Without More Bears
The S&P 500 is flat on the week but the index did tag record highs on Monday. In spite of this, sentiment has turned lower as the AAII survey showed bullish sentiment fall four percentage points to 36.2% this week. That took out the low of 36.4% from the week of May 27th to make for the lowest reading since the last week of October.
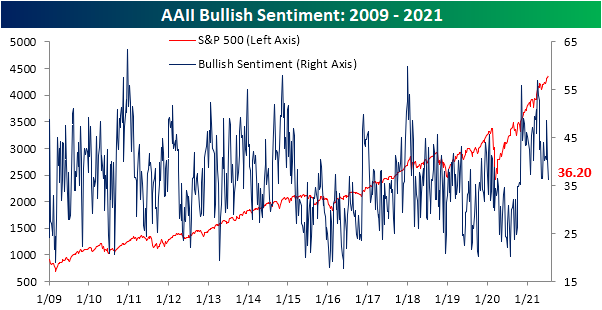
Some of those declines were picked up by bearish sentiment which rose to 26.8% from 24.5%. Whereas bullish sentiment is at one of the lowest levels in months, that is only the highest level in bearish sentiment since May 13th.
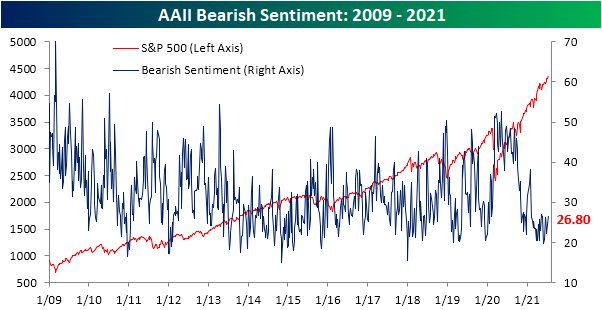
With bearish sentiment having risen only slightly while bullish sentiment experiences a more significant decline, the bull-bear spread has fallen to 9.4. That is at the low end of the past several months’ range.

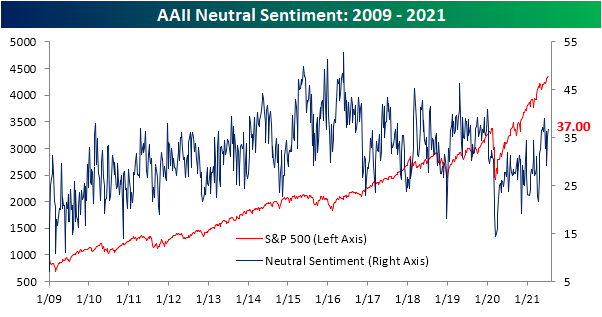
Instead, the losses to bullish sentiment have been picked up by the neutral sentiment camp as this week’s reading topped 37%. While late May and early June saw similar to slightly higher readings, that level of neutral sentiment is elevated relative to the historical average of 31.43%.
Overall, the AAII survey has shown individual investors have become increasingly less optimistic, albeit not outright bearish, over the past few weeks. And while that may be the case for this group, equity newsletter writers have been another story. The sentiment survey from Investors Intelligence (II) covering this section of the market participants has maintained a more optimistic outlook. This week, 61.2% of respondents reported as bullish which is the highest reading since April. That also comes in the top 5% of all readings since the start of the survey in the early 1960s.
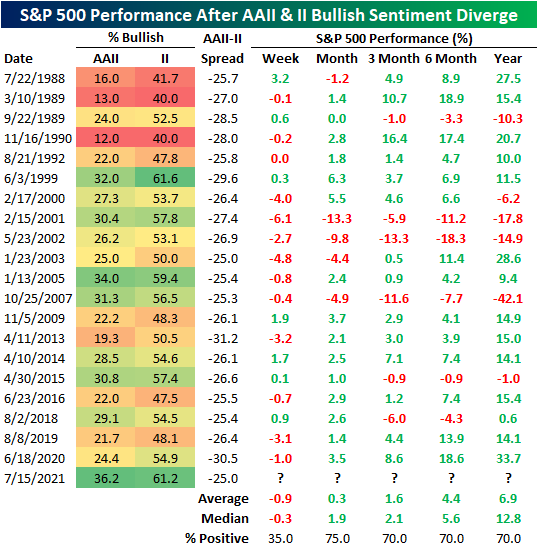
In the chart below, we show the spread in the bullish sentiment readings of the AAII and Investors Intelligence surveys. This week, that spread fell down to -25 (meaning the percentage of respondents reporting as bullish in the AAII survey is 25 points lower than in the Investors Intelligence survey). That is the lowest reading in the spread since October and it is also in the bottom 5% of all periods.

There have been 20 times in which the spread has dipped below -25 without having done so in the prior six months. As shown, these instances are not particularly rare with about a year or two between each one. But what is notable about the current instance is how elevated the bullish sentiment readings are for each survey. As for what this means for the performance of the S&P 500, in the near term performance has tended to have a negative bias, but moves higher are much more consistently seen in the months to a year after. Click here to view Bespoke’s premium membership options.
The Bespoke 50 Top Growth Stocks — 7/15/21
Bespoke’s Weekly Sector Snapshot — 7/15/21
Chart of the Day: Emerging Markets Rotation Under The Hood
Claims Flatter Than Shown
It was a busy morning of economic data with weekly jobless claims part of the onslaught of releases. Overall, this week’s report was mixed. Last week’s reading on initial jobless claims was revised higher from 373K to 386K. While this week’s number did mark an improvement falling to 360K, it was less than the expected decline to 350K. Regardless, that leaves claims at the lowest level of the pandemic and a little over 100K above the levels from last March; the last week before claims began to print in the millions.

While the decline in the seasonally adjusted number marked an improvement, we would note that actual claims were flat which was better than you would expect for this time of year. Early July historically has seen a seasonal headwind to claims, and as such, seasonal factors would have suggested a 26.5K increase this week. But on a non-seasonally adjusted basis, claims were actually little changed (up only 0.6K). At 383.2K, unadjusted claims still sit 20K above the pandemic low of 362.9K from two weeks ago. PUA claims meanwhile fell back below 100K as the withdrawal of individual states from pandemic era programs continue to apply to the data. Overall, claims continue to show improvement albeit at a slower pace.

While initial claims were worse than expected, continuing claims fell by 126K versus the expected 67K decline. Seasonally adjusted claims now are at 3.241 million which is the lowest level since last March. That also marked the first back-to-back decline since the first two weeks of April which was part of a much longer 14-week streak of declines.

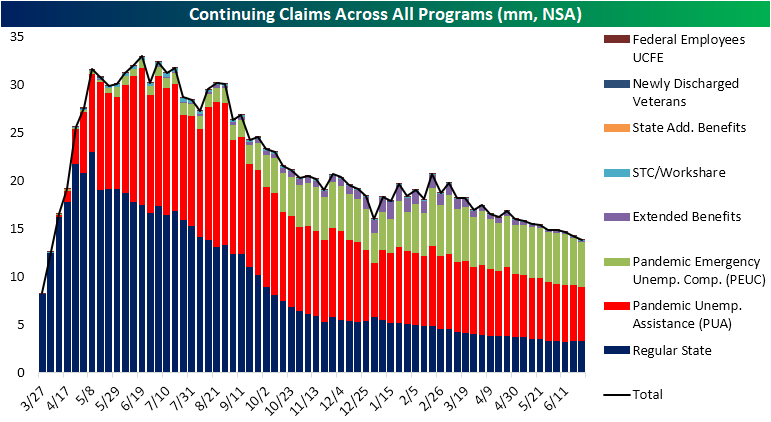
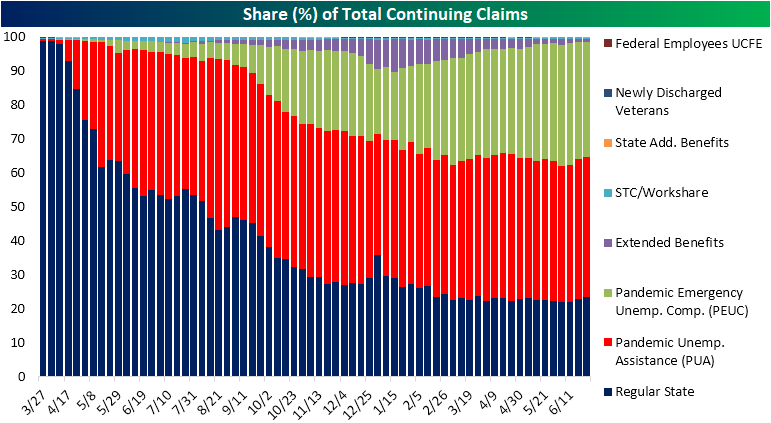
Pivoting back over to the unadjusted data, which includes all other auxiliary programs but creates an additional week of lag, the most recent week saw broad declines across all major programs resulting in total continuing claims to fall below 14 million. The 372K decline this week also extended a streak of eight consecutive weeks of declines. As for the main drivers of that decline over the past couple of months, PUA and PEUC programs have by far been the biggest contributors, in part, due to the withdrawal of various states from the programs. This week alone the two programs accounted for 90% of the decline, and over the previously mentioned eight-week span, the two programs account for 70% of the total decline. Click here to view Bespoke’s premium membership options.