Chart of the Day: Wall Street Winning
The Closer – La Cucaracha, Beige Book, Credit Cards – 10/15/25
Log-in here if you’re a member with access to the Closer.
Looking for deeper insight into markets? In tonight’s Closer sent to Bespoke Institutional clients, we start with a note on the two significant credit blow ups in September and a quantitative look at the Beige Book (page 1). Next, we review the latest credit card delinquency rates (page 2) and wrap up with a recap of the latest transport earnings (page 3).
See today’s full post-market Closer and everything else Bespoke publishes by starting a 14-day trial to Bespoke Institutional today!
Daily Sector Snapshot — 10/15/25
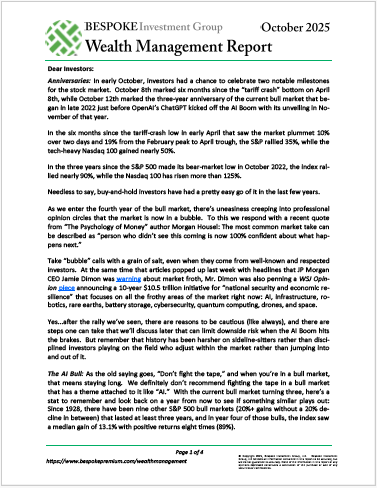
Bespoke’s Wealth Management Report – October 2025
Please click here or on the link below to read our latest quarterly Wealth Management Report. You can learn more about Bespoke’s wealth management services available to investors here or by calling our office at 914-315-1248.
Below are links to prior quarterly Wealth Management Reports:
Bespoke Baskets Update – October 2025
Chart of the Day – Upcoming Earnings
Bespoke’s Morning Lineup – 10/15/25 – You Can’t Take it Back
See what’s driving market performance around the world in today’s Morning Lineup. Bespoke’s Morning Lineup is the best way to start your trading day. Read it now by starting a two-week trial to Bespoke Premium. CLICK HERE to learn more and start your trial.
“Stock prices have reached what looks like a permanently high plateau” – Irving Fisher, 10/15/29

Below is a snippet of commentary from today’s Morning Lineup. Start a two-week trial to Bespoke Premium to view the full report.
After a sell-off into the close yesterday, equity futures are rallying this morning on the back of strong rallies in Asia and Europe. S&P 500 futures are up 75 bps while the Nasdaq is up 1%. In the commodities space, crude oil is little changed, while gold is up another 1% and now over $4,200 per ounce.
While there’s little economic data on the calendar again today, it’s been another strong showing for earnings this morning as eight of the ten companies reporting exceeded bottom-line results, while Progressive (PGR) was the only miss. Revenues have also been strong as the pace of beats has been nearly as strong.
We’ve all said things that we wish we could take back, and we can all come up with countless examples involving a boss, friend, family member, spouse, and/or our kids. You don’t need us to give you examples. In a less personal sense, it’s always funny to look back at past comments from public figures and, with the benefit of hindsight, see how foolish or wrong their comments turned out to be.
The stock market has seen a lot, but one of the most famously disastrous comments was made exactly 96 years ago today when an economist named Irving Fisher spoke at an industry trade dinner in New York. Fisher was one of the most well-known economists of his generation. Joseph Schumpeter called him the “greatest economist the United States has ever produced”. His theories on the velocity of money helped him forecast swings in inflation and the economy, and he wrote a weekly economic column that was read by millions of readers. He spoke to audiences all over the country, and they hung on every word.
The most famous or infamous of those speeches came on 10/15/29 when he made the quote above, and then followed it up later on in an informal Q&A session, saying he expected “to see the stock market a good deal higher than it is today, within a few months.”
When Fisher made those comments, the equity market was coming off a solid year of gains. While the Dow was down about 8% from its September high, it was still up over 40% in the prior year. And that was coming off what had been one of the strongest four-year stretches in stock market history, where the index had tripled! Given the path equities had taken, Fisher’s comments were hardly out of consensus. At that point, gains were expected.
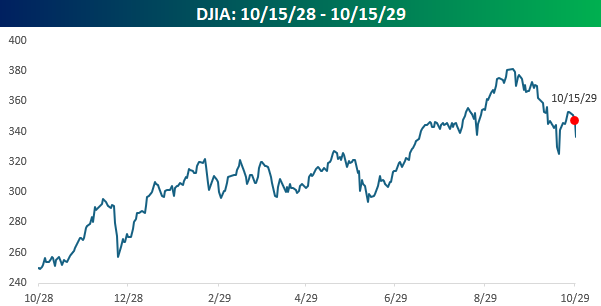
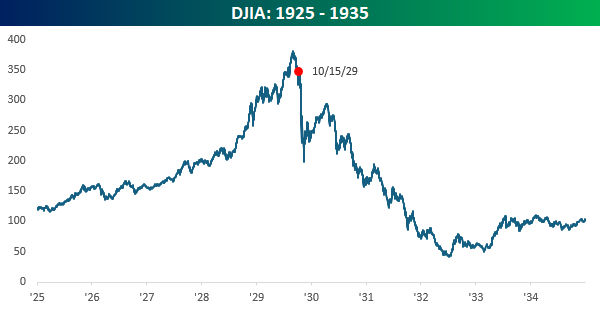
While investors were feeling entitled to gains, what the market giveth, it can quickly take away. The day after his comments, the Dow fell by over 3%. Then, after a one-day bounce of 1.7%, it had back-to-back declines of over 2.5%. Then, it kept falling from there. On 10/23, the DJIA fell 6.3%. On 10/24, it fell another 2%. Then, on 10/28, the crash came as the Dow fell 13% followed by another decline of 12% the day after that. Just after Labor Day of 1929, the Dow was at record highs, basking in the heat of the roaring 20s. Now, less than two months later, it was down 40%.
Looking at a ten-year window of the Dow from 1925 to 1935, from its peak in 1929 to the low three years later, it lost nearly 90% of its value. The economy sank into the Great Depression, erasing generations of wealth and causing permanent damage to the fabric of the US economy. Maybe not creative, but destruction nonetheless!
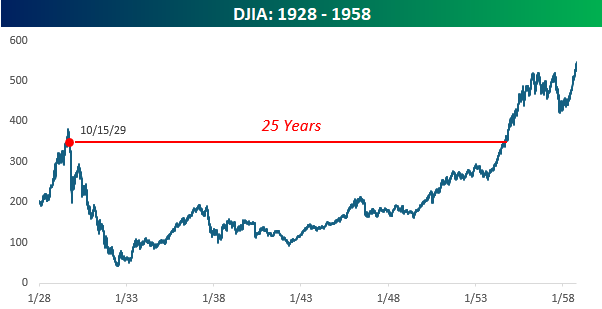
The S&P 500 closed at record highs just a week ago today, so no matter how steep the selloffs have been over time, the market has always come back. Sometimes, though, the comebacks take longer than others. After the peak this February, it only took a few months. After the 2022 peak, though, it took two years for the market to make new highs. Coming out of the Financial Crisis, it took close to five years. After the dotcom bust, it took seven years. The takeaway is that it’s all about time horizons. If you’re invested in the stock market, long periods of drawdowns shouldn’t necessarily be a baseline expectation, but they should be part of the plan. Coming out of the 1929 peak and Fisher’s comments from October 1929, those levels on the Dow wouldn’t be seen again for another 25 years! That type of drought should certainly not be a base case for investors, but it should provide some balance to a growing feeling of entitlement in some areas of the market where double-digit daily percentage gains are starting to feel like an Inalienable right.
The Closer – Energy Glut, First Earnings, Freight Fumble – 10/14/25
Log-in here if you’re a member with access to the Closer.
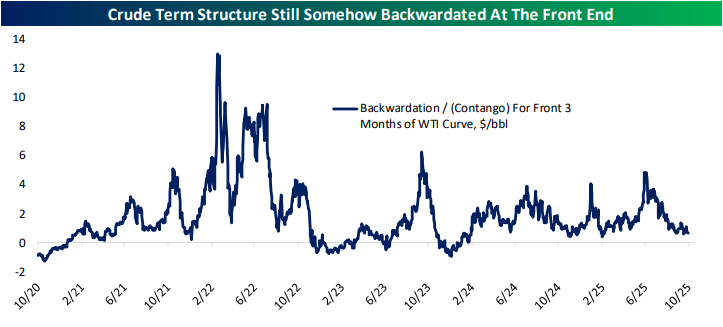
Looking for deeper insight into markets? In tonight’s Closer sent to Bespoke Institutional clients, we kick off with a look into the growing supply glut of crude oil (page 1) in addition to how that functions into the term structure (page 2). We also review how oil companies look in addition to recapping today’s earnings and Fedspeak (page 3). We finish with a recap of the latest freight data and the lagging performance of associated stocks (page 4).
See today’s full post-market Closer and everything else Bespoke publishes by starting a 14-day trial to Bespoke Institutional today!
Silver Squeeze
Silver futures paused their breathtaking rally today after its first trip over $50/oz since the 1980s on Friday. Year-to-date, spot silver has risen over 70%, outperforming gold’s 56% gain or bitcoin’s 19% advance, let alone the downright pedestrian 14% move in stocks.
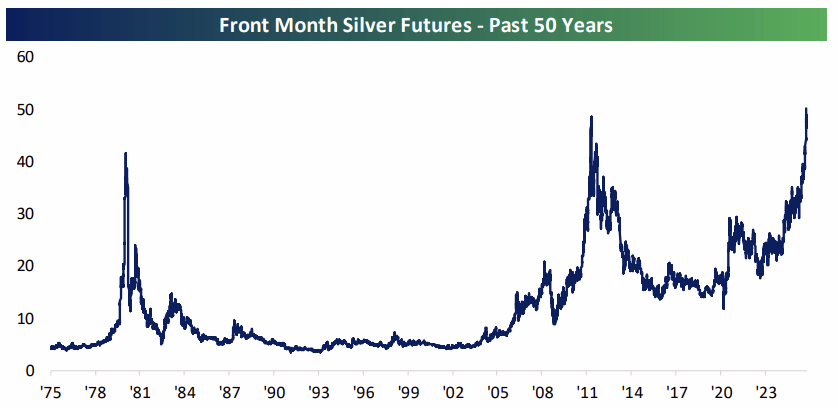
One massive driver of the move has been a physical short squeeze in the London silver market specifically. Earlier this year, US imports of silver surged with much of the bullion being sourced in London. Traders were trying to make sure they could inventory silver in the US for financial speculation and industrial uses before tariffs hit, and as a result, inventories of silver in London cratered while they surged in New York. The blistering rally in silver that has taken place since helped drive the London market into chaos as it didn’t have enough physical bullion to be delivered amidst rapid price gains. The result is an epic short squeeze, not as large as the infamous Hunt Brothers squeeze in US silver markets back in 1980 but nonetheless impressive. New York spot silver now trades at the largest discount to silver in London since the Hunt Brothers episode and the volatility that came with it.
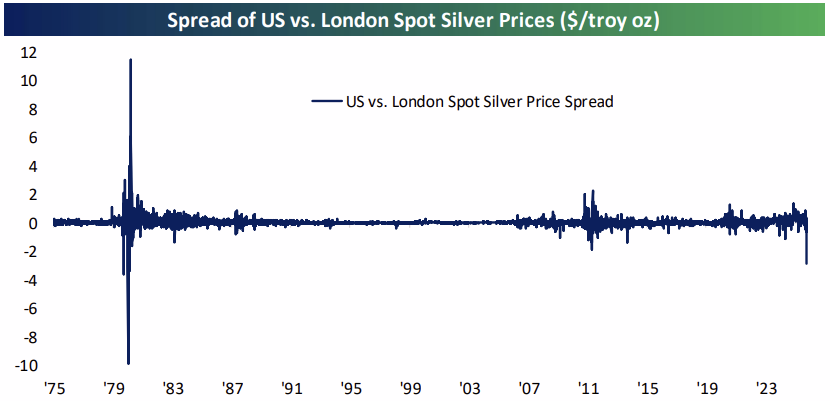
With not enough silver to go around, lease rates on silver in vaults have soared; borrowing silver to deliver on futures contracts and other derivatives is still possible, it’s just a lot more expensive to accomplish than has been the case in recent years as shown in the chart below.
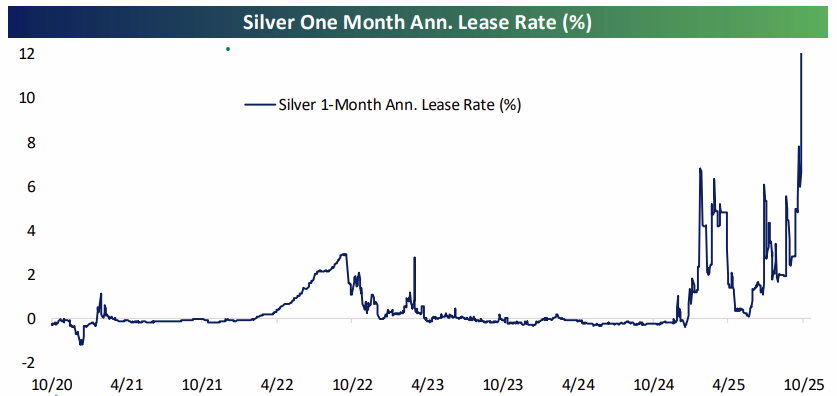
The soaring cost of borrowing silver thanks to a lack of bullion in London is a good example of the pitfalls of a precious metal-backed financial system. The oddity of tariffs have served as a sort of supply shock, similar to mines going offline due to a natural disaster. When supply drops, price (the lease rate) rises. In an economy reliant on bullion to anchor its money supply, positive or negative supply shocks can have a huge impact on money supply, regardless of whether economic circumstances like growth or inflation justify changes in the cost of money (interest rates). That’s one very good reason that the world shifted from gold or silver anchors to fully fiat currencies during the 20th century.
Like this content? This analysis was included in our nightly macro note, The Closer, on 10/13. We are sharing it here on a complimentary basis. To receive our Closer in your inbox daily, start a two-week trial to Bespoke Institutional today.

Small Business Hesitation
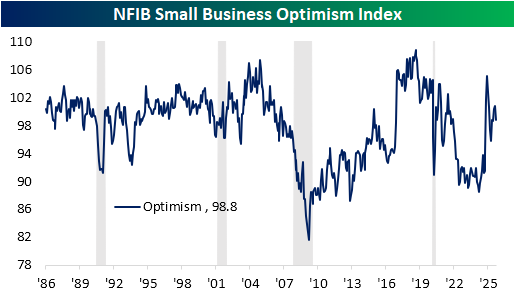
The continued US government shutdown means there remains a drought in official economic data, putting extra emphasis on unofficial data points. One such set of data is monthly small business optimism from the NFIB released this morning. The headline index dropped to 98.8 in September versus 100.8 previously in August. As we often note, including in our discussion of the report’s labor market readings in today’s Morning Lineup, the NFIB survey has historically leaned right similar to how Michigan Confidence has leaned left. Such biases mean that the data has to be taken with a grain of salt and some categories become more worthwhile in gauging economic health than others. As shown below, optimism surged in the wake of President Trump’s election last year. A similar surge was seen following the 2016 presidential election and vice versa after President Biden won in 2020. At current levels, optimism is middling versus the past decade’s range.
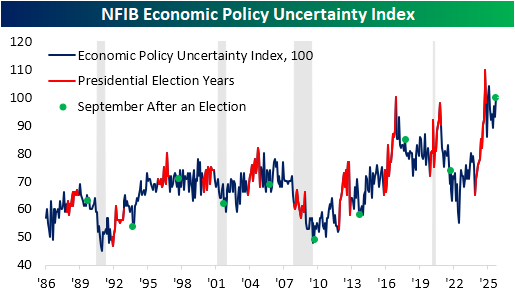
One area that is far from middling is uncertainty. Again, this is another indicator from NFIB that is a bit more sensitive to politics. Typically, the Economic Policy Uncertainty Index soars during Presidential election years and then pulls back in the following months; usually that pullback is regardless of which party came out on top. During last year’s run up to the election, this index saw a record climb, but interestingly, it has yet to reverse lower as it usually does after elections.
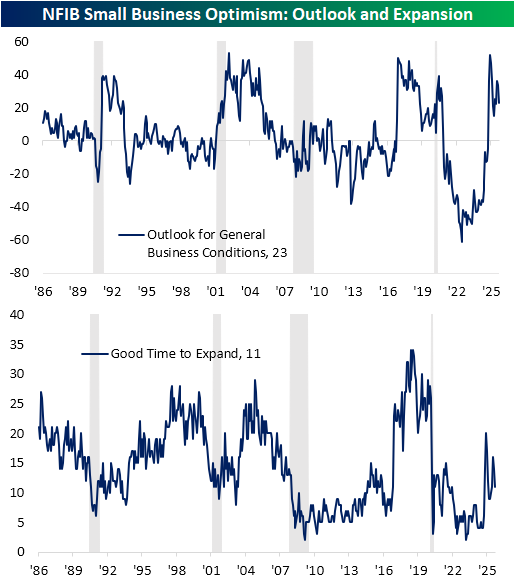
In other words, small businesses are still on edge when it comes to policy. That is putting a dampener on sentiment with fewer businesses reporting a positive outlook for the economy/general business conditions. Similarly, fewer respondents reported that they view now as a good time to expand their businesses.
When it comes to the question of business expansion, respondents are also asked for the reasons for given outlooks. For those reporting negative and uncertain outlook, the largest share of respondents (40%) reported that it is due to economic conditions. That is up versus the multi-year low of 32% two months prior. While that reading is rebounding, it hasn’t really reversed the downtrend of the past several years. While not shown in the chart below for legibility, the next two most common reasons given were cost of expansion and political climate; each of those came in at 12% which is right in line with their respective average over the past year. Finances and interest rates were right on their heels at 11%, and this reading has the more interesting trend. The share viewing rates and finances as restrictive to expansion has steadily been climbing despite the latest rate cuts.
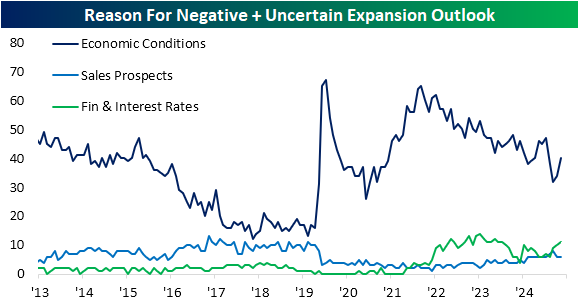
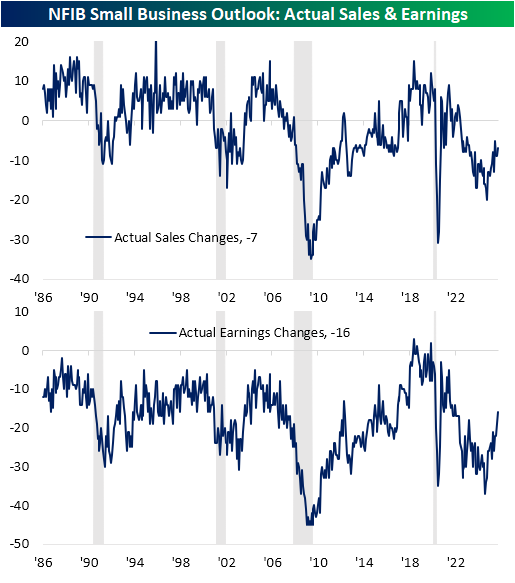
Finally, we would note that sales prospects are not a very common reason given for a negative or uncertain expansion outlook, and paired with other categories in the report, would overall suggest solid demand. As shown below, actual sales changes are negative (as has been the norm for the better part of the past 20 years) but approaching some of the strongest levels since Q1 2023. Meanwhile, actual earnings changes have rocketed higher up to the best level since December 2021.